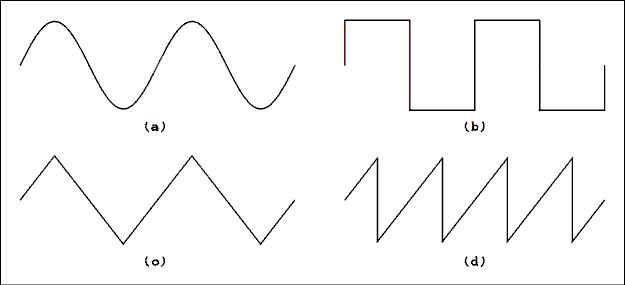
Figure 2.1 Four Different Waveforms.
For a verbal description click here.
Chapter 2 AC Circuits.
2.1 Alternating Current.
2.2 Capacitive Reactance.
2.3 Inductive Reactance.
2.4 Series Circuits and Impedance.
2.5 RC Filter Circuits.
2.6 The Decibel (dB).
2.7 Graphing Frequency Response.
2.8 Nonsinusoidal Waves.
2.9 The Effect of RC Circuits on Nonsinusoidal Waves.
2.10 RLC Resonate Circuits.
2.11 Transformers.
2.12 The Oscilloscope.
2.13 Problems.
2.14 Answers to Problems.
Chapter 2.
AC Circuits.
To date, we have dealt with sources of electrical energy which deliver direct current. DC flows continuously in one direction. The electrical world in which we live is one of alternating current (AC). The current supplied by the electric utility, audio signals, radio and television signals are all AC.Back to Fun with Transistors.
Back to Fun with Tubes.
Back to Table of Contents.
Back to top.
2.1 Alternating Current.
Alternating current reverses its direction on a regular time schedule. The current flows for a certain period of time, then reverses and flows for the same amount of time and then reverses again. There is no net movement of electrons in a wire carrying AC; the electrons simply vibrate in place.The Cycle.
A cycle is defined as follows. The current rises from zero to a positive maximum, falls back to zero and "rises" to a negative "maximum" and then returns to zero. This definition of a cycle applies to current or voltage. For a cycle of voltage simply substitute the word "voltage" for "current" in the above definition.If we plot a number of cycles on a graph (with current on the Y axis and time on the X axis) the plot will resemble the waves on the surface of a body of water. It is not considered correct usage to call a cycle a wave but even people with many years of experience sometimes get careless. It is considered correct usage to use the term waveform when referring to the shape of the graph of a cycle.
Notice that the definition of a cycle says nothing about the shape of the rises and falls. The cycle shape or waveform which is most often encountered is the sine wave. This waveform follows the sine function y = sin(x). Figure 2.1a shows two cycles of a sine wave alternating current. Figure 2.1b shows a square wave, 2.1c a triangular wave and 2.1d a sawtooth wave. There are an infinite number of different waveforms. The shape depends on what is generating them and what their use will be.

Figure 2.1 Four Different Waveforms.
For a verbal description click here.
Period and Frequency.
The period of an alternating current is the time required to complete one cycle. The frequency of an alternating current is the number of cycles which occur each second. The period is measured in units of time such as seconds, milliseconds or microseconds. The frequency has units of cycles/second or 1/time (a cycle is not a true unit, it is considered to be dimensionless.) The unit of frequency is called the hertz. Frequency may be given in hertz, kilohertz, megahertz or gigahertz.The relationship between period and frequency is
P = 1 / f (2.1) where P is the period in seconds and f is the frequency in hertz.
Example 2.1.
What is the period of the 60 hertz line frequency?Solution:
P = 1/f = 1/60 = 1.67 x 10⁻² seconds or 16.7 ms.Wavelength and Frequency.
The only time that the term "wave" may be applied to an alternating current is when the current has been converted into a periodic disturbance which propagates through some medium. For example a loudspeaker converts AC of appropriate frequency into sound waves which propagate through the air. For another example, if AC of an appropriate frequency flows in a structure known as an antenna, electromagnetic waves will be radiated which will propagate through air, or the vacuum of space.When waves propagate through a physical medium, the wave has a physical length. The wavelength is given by
lambda = v / f (2.2) where lambda is the wavelength in meters, v is the velocity of propagation in meters per second and f is the frequency in hertz. The speed of sound in air is approximately 335 meters per second and the speed of electromagnetic waves is 3 x 10⁸ meters per second.Example 2.2.
A sound wave in air has a wavelength of 12 cm. What is its frequency?Solution:
Using the speed of sound we have thatf = 335 / 0.12 = 2790 Hz.
Example 2.3.
A radio station is transmitting on a frequency of 88.9 MHz (megahertz). What is the wavelength of the electro- magnetic wave being transmitted?Solution:
Using the speed of light we havelambda = 3 x 10⁸ / 88.9 x 106 = 3.37 m
Angular Frequency.
When working through calculations involving AC it is often necessary for the frequency to appear in the argument of a sine or cosine function. A particular point on a waveform can be found by multiplying the frequency by the amount of time which has passed since the waveform has started. This would be all right if cycles were the only thing we had to deal with. The arguments of sines and cosines must be in angles, not in cycles.One cycle consists of 360 degrees or 2 pi radians. The symbol for the angular frequency is usually a small omega but we will use a "w". The angular frequency is given by
w = 2 pi f (2.3) where w is the angular frequency in radians per second and f is the frequency in hertz (cycles per second). A current can be expressed by the equationi = I sin( 2 pi f t ) (2.4) where i is the current at any instant of time, I is the peak current, f is the frequency of the current in hertz and t is time in seconds. If f = 1 hertz then during the passage of one second the argument of the sine function will run through 2 pi radians and the sine function will execute one cycle in accordance with the definition of a cycle given above.Magnitude Measurement of AC.
An alternating current may be represented by equation 2.4. The peak value of the current is "I" and the peak-to- peak value is 2I. The peak and peak-to-peak values are the most obvious and easiest to measure, which is probably why they are not the most often used.The most useful measure of AC is a value which gives the same power dissipation in a resistor as a direct current. Suppose that a DC current of 3 amperes is flowing through a 1 ohm resistor. The power will be 9 watts. If an AC current of 3 amperes peak flows through a 1 ohm resistor, the power is not the same as for the DC. We require a measure which will give the same power as a DC of the same magnitude.
Because we are discussing power, that is the key. Remember that power is given by
P = I2 R (2.5) When a resistor is being heated, the average power is what is affecting the heating. To find the measure of current we must square the current, average it over time and then take the square root. The last step is necessary so that the new measure will be proportional to the peak current, not to the square of the current. The new measure of current is called the root-mean-square which is abbreviated RMS.The RMS value of a current is given by

Substituting equation 2.4 into equation 2.6 we have

We don't know how to integrate the sine squared function but there is a way to change it to something we can integrate. We must make the trigonometric substitutionSin2(t) = 1/2 ( 1 - cos( 2t )) Making this substitution and bringing I2 and 1/4 outside of the radical givesThe integral of the cosine over an integer number of cycles is zero; therefore, 
The end result of all of this is 
This is another one of those things you must remember. Conversions between RMS and peak, RMS and peak-to-peak, and peak and peak-to-peak are routine in electronics. The conversion applies to voltage as well as current. 
Example 2.4.
Convert a peak current of 3 amperes to RMS.Solution:
IRMS = I / square root of 2 = 3 / 1.4142 = 2.12 AExample 2.5.
Convert 6.3 v RMS to peak.Solution:
VP = VRMS x square root of 2 = 6.3 x 1.4142 = 8.91 vThe use of the RMS measure is so common in AC measurement that all quantities are RMS unless otherwise specified. If a specification gives a voltage as 117 vAC the meaning is 117 volts alternating current RMS (root-mean- square). The rule is: a voltage or current is RMS unless otherwise noted.Logical Check.
The RMS value is always less than the peak value. RMS is a kind of average and an average will ALWAYS be less than the maximum. Similarly, the peak to peak value is greater than the peak value.The Average.
One more AC measurement is worth mentioning. It is the average value. If an AC flows through a D'Arsonval meter movement the pointer will first be urged in one direction and then in the other. Most AC is of such a frequency that the meter's pointer cannot respond to either urging and the pointer does not move. If a rectifier is used to take the absolute value of the sine function, the meter will be able to respond to the unidirectional current in spite of the fact that it is changing with time. The meter will respond to, and indicate, the average value of the sine wave current.If we averaged the sine function over one full cycle we would get zero. To obtain the average value of the absolute value of the sine it is sufficient to average it over one- half cycle.
A few turns of the crank gives 
IAV = I x 0.63662 (2.9) Most AC meters respond to average but are calibrated in terms of RMS. These meters work fine as long as the current or voltage being measured is a sine wave. If the input is not a sine wave the meter will not read the RMS but will read the average value times 0.70711 / 0.63662.Use and Misuse.
The term AC is often used in ways which seem to be redundant or even contradictory. For example you might read "... the AC current ..." or "... the AC voltage ..." or even "... the AC power ...". Remember that the letters AC stand for alternating current. The first example is redundant, "alternating current current". The next two are contradictory. In spite of the redundant or contradictory nature of these terms they are used by most electrical and electronics engineers and technicians. The usage is too pervasive to be avoided even in formal writing. The writer will not make a rigorous attempt to exclude these terms from this book.Back to Fun with Transistors.
Back to Fun with Tubes.
Back to Table of Contents.
Back to top.
2.2 Capacitive Reactance.
Early researchers in electricity may have been surprised to find that AC would flow through a capacitor. After all, a capacitor is an open circuit, isn't it? Experiments on capacitors show that as more AC voltage is applied more current will flow. If the frequency is increased without changing the voltage the current will increase. It can also be shown experimentally that the current in a capacitor leads the voltage by 90 degrees or 1/4 of a cycle. The way in which a capacitor reacts to AC is called the capacitive reactance.Let us apply a voltage to a capacitor and see what happens. The voltage is v = V sin( 2 pi f t ). We will use equation 0.41 which is restated here as equation 2.10.
i = C dv / dt (2.10) If we insert our definition of voltage into equation 2.10 we havei = CV d / dt sin ( 2 pi f t ) Performing the differentiation gives.i = C V 2 pi f cos( 2 pi f t ) If we say that the current is i = I cos( 2 pi f t ) we have thatI = C V 2 pi f solving for V/I gives.V / I = 1 / ( 2 pi f C ) If you are awake you will recognize V / I as having the units of ohms. We now have a new quantity which in some ways is like resistance but in other ways is unlike resistance. We call this quantity the capacitive reactance and give it the symbol XC.XC = 1 / ( 2 pi f C ) (2.11) where XC is the capacitive reactance in ohms, f is the frequency in hertz and C is the capacitance in farads.We applied a sine wave voltage and a cosine wave current resulted. The cosine leads the sine by 90 degrees and so the current in a capacitor leads the voltage by 90 degrees.
Example 2.6.
At what frequency will a .0039 uf capacitor have a reactance of 33 k ohms?Solution:
Solving equation 2.11 for f givesF = 1 / ( 2 pi XC C)
f = 1 / ( 2 pi x 3.3 x 104 ohms x 3.9 x 10⁻⁹ f ) =
1.24 x 10³ Hz.Example 2.7.
If a 0.1 uf capacitor is connected across the 120 vAC 60 Hz power line, how much current will flow?Solution:
The reactance of a 0.1 uf capacitor at a frequency of 60 Hz is XC = 1 / ( 2 pi f C )XC = 1 / ( 2 pi x 60 Hz x 1 x 10-7 f ) = 2.653 x 10⁴ ohms.
I = E / XC = 120 v / 2.653 x 10⁴ ohms = 4.52 x 10⁻³ A.
Power.
When an AC voltage is applied to a resistor, the current is in phase with the voltage. The instantaneous power isp = (V sin( 2 pi f t ) ) x (I sin( 2 pi f t ) which is equal toP = V x I x sin2( 2 pi f t ). By trigonometric substitution the sine squared function becomes a double frequency negative cosine function.P = V x I x 1/2 (1 - cos( 2 pi 2 f t )). This function is entirely positive. When AC is applied to a resistor the power is "real". All energy flows from the generator into the load.When an AC voltage is applied to a capacitor, the current leads the voltage by 90 degrees. The instantaneous power is
p = (V sin( 2 pi f t ) ) x (I cos( 2 pi f t ). Making the substitution for sine times cosine gives.P = V x I x sin( 2 pi 2 f t ) The sine times the cosine is a double frequency sine which has equal parts above and below the horizontal axis. This means that power is taken from the circuit for half of the time and given back for the other half of the time. The net value of power averaged over time is zero.Here we have an incongruous situation. There is a voltage applied to a circuit element (capacitor) and there is a current flowing but the power is zero! This can be verified experimentally. It must have been "mind blowing" for the first person (probably a graduate student) who observed it.
Back to Fun with Transistors.
Back to Fun with Tubes.
Back to Table of Contents.
Back to top.
2.3 Inductive Reactance.
Early researchers in electricity must have been surprised to find that a coil of wire presented more "resistance" to the flow of alternating current than did the identical length of wire which was not wound into a coil. Experiments on inductors show that as more AC voltage is applied more current will flow. If the frequency is increased without changing the voltage the current will decrease. It can also be shown experimentally that the current in an inductor lags the voltage by 90 degrees or 1/4 of a cycle. The way in which an inductor reacts to AC is called the inductive reactance.Let us apply a current to an inductor and see what happens. The current is i = I sin( 2 pi ft ). We will use equation 0.55 which is restated here as equation 2.12.
e = L di / dt (2.12) If we insert our definition of current into equation 2.12 we havee = L V d/dt sin(2 pi f t ) Taking the derivative gives.e = L V 2 pi f cos( 2 pi ft ) If we say that the voltage is e = E cos( 2 pi ft ) we have thatE = L I 2 pi f solving for E givesE / I = 2 pi f L If you are awake you will recognize E / I as having the units of ohms. We now have a new quantity which in some ways is like resistance but in other ways is unlike resistance. We call this quantity the inductive reactance and give it the symbol XL.XL = 2 pi f L (2.13) where XL is the inductive reactance in ohms, f is the frequency in hertz and L is the inductance in henrys.We applied a sine wave current and a cosine wave voltage resulted. The cosine leads the sine by 90 degrees and so the voltage in an inductor leads the current by 90 degrees.
Example 2.8.
What is the value of an inductor which will present a reactance of 47 k ohms at a frequency of 100 kHz?Solution:
Solving equation 2.13 for L we haveL = XL / ( 2 pi f )
L = 47 k ohms / ( 2 pi 100 kHz ) = 7.48 x 10⁻² H or 74.8 mH
Example 2.9.
If a 500 uH inductor is used in a power line filter, how much voltage drop will be introduced at a current of 25 amperes?Solution:
The power line frequency in the U.S. is 60 Hz. XL = 2 pi f LThe power in a pure inductance is zero by the same argument as for capacitors. It makes no difference that the current is lagging instead of leading. The phase difference is still 90 degrees.XL = 2 pi x 60 Hz x 500 uH = 0.1885 ohms
The voltage drop is I x XL = 25 A x 0.1885 ohms = 4.71 v
Back to Fun with Transistors.
Back to Fun with Tubes.
Back to Table of Contents.
Back to top.
2.4 Series Circuits and Impedance.
DC circuit analysis contains only resistors and DC sources. Most real circuits operate using AC and employ capacitors and inductors. Because we must be capable of analyzing AC circuits as well as DC circuits we must study some new techniques. In this section we will develop some simple tools for the analysis of series AC circuits.Series RC Circuits.
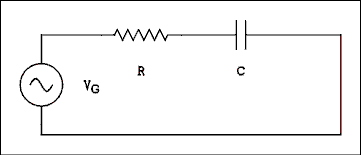
Figure 2.2 Series RC Circuit Driven by an AC Generator.
For a verbal description click here.
Figure 2.2 is the diagram of a simple RC circuit which contains an AC generator. The generator can take on any output voltage and any frequency.Kirchhoff's law tells us that the current everywhere in the circuit will have the same magnitude. An extension of this law to AC circuits is to add phase. The current everywhere in the circuit will have the same phase. The current in the generator, the current in the resistor and the current in the capacitor are all in phase with each other.
The voltage across the resistor will be in-phase with the current through it. Resistors do not play tricks on us; they obey Ohm's law. The voltage and current in a resistor are always in-phase with each other.
The phase relationship between the voltage and current in a capacitor is 90 degrees with the current leading. If the current leads, the voltage follows or lags. In this example we are using the current as a reference so we say the voltage is lagging the current by 90 degrees. This can be represented pictorially as in Figure 2.3.
In Figure 2.3 the voltages and currents are represented by line segments in a plane. These lines have length and direction. Some texts refer to these as vectors. Vectors have magnitude and direction in real space and are (or at least can be) three-dimensional. The lines which represent voltages and currents cannot be three-dimensional; they are strictly two-dimensional. In addition to this, the directions do not represent directions in space, they represent relative phases of voltages and currents in electric circuits. For all of these reasons, the lines are called phasors. It should be noted that this term has been in common use in electrical engineering texts and by electrical engineers for a long time and predates the television show "Star Trek" by several decades.
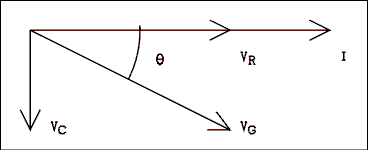
Figure 2.3 Phase Relationships of Voltages and Currents.
For a verbal description click here.
Figure 2.4a is the diagram of an R-L circuit. The phasor diagram for this circuit is shown in Figure 2.4b. In an inductor the voltage leads the current by 90 degrees and so the voltage phasor is shown pointing upward. As always the voltage and current are in-phase in a resistor.
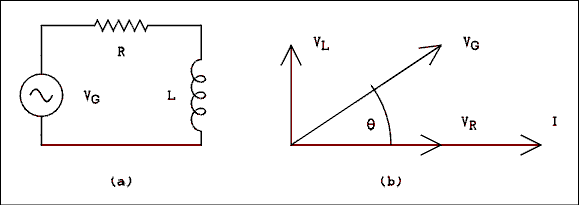
Figure 2.4 (a) R-L Circuit and (b) Its Phasor Diagram.
For a verbal description click here.
Kirchhoff's law tells us that the voltage of the generator in Figure 2.2 is the sum of the voltage across the resistor and the voltage across the capacitor. These voltages are not in phase and they cannot be added simply by adding their magnitudes. Their directions must also be taken into account. Even though we do not call them vectors the techniques of vector addition apply. As vector addition should be well known to any student studying physics, we will not dwell on the addition of vectors (phasors).The fact that these phasors are at right angles makes life a lot easier for us. The familiar Kirchhoff's equation for voltages looks like this for AC:
where VG is the generator voltage, VR is the voltage across the resistor and VC is the voltage drop across the capacitor. 
The phase angle theta of the generator voltage is given by
theta = arctan ( VC / VR ) (2.15) To obtain the correct sign on the angle you must attach a minus sign to VC and a plus sign to VL.
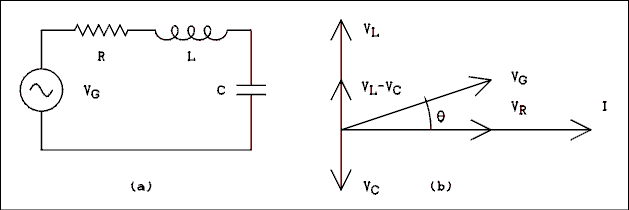
Figure 2.5 R-LC (a Circuit and (b> Its Phasor Diagram.
For a verbal description click here.
If we now combine resistance, capacitance and inductance in the same circuit, as in Figure 2.5a, the phasor diagram of Figure 2.5b will result. Since VL and VC are 180 degrees apart, one will always subtract. The phasor version of Kirchhoff's voltage equation is as follows.The phase angle is given by 
Theta = arctan ( ( VL - VC ) / VR (2.17) Example 2.10.
In Figure 2.2 the magnitudes of the voltages are as follows. VR = 77.460 v at 0 degrees and VC = 91.652 v at -90 degrees. What are the magnitude and phase of the generator voltage?Solution:

The phase angle is
theta = arctan ( -91.652 v / 77.460 = 49.80 degrees.
Ohm's Law For AC.
When we made the change from DC to AC we did not repeal Ohm's law. Its form is just a little different. For resistors it is unchanged.VR = I R (2.18) For capacitors and inductors it is as follows.VC = I XC and VL = I XL (2.19) For a series combination of RC or R-L we will call the "resistance" something different.VG = I Z (2.20) The quantity Z is called impedance and is the ratio of the generator voltage to the generator current. The impedance like the generator voltage has magnitude and angle. It is a phasor.We can get equations for the magnitude and angle of the impedance by substituting equations 2.18, 2.19 and 2.20 into equations 2.16 and 2.17. Because the current is the same everywhere in the circuit it will cancel out and leave us with these equations. The magnitude is
The phase angle is given by 
theta = arctan ((XL - XC) / R (2.22) Impedance magnitude and phase angle involve reactances which are frequency dependent. An impedance can be calculated only if the frequency is fixed and known. If the frequency is changed, the impedance must be recalculated.Example 2.11.
In Figure 2.2 R = 1 k ohms, C = 0.1 uf and f = 1 kHz, what is the impedance?Solution:
First, XC must be determined.XC = 1 / ( 2 pi 1000 x 0.1 x 10-6 ) = 1592 ohms
The magnitude of the impedance is

The phase angle is
theta = arctan (-1592 ohms / 1000 ohms) = -57.87 degrees.
The accepted way of writing this is
Z = 1880 ohms / -57.87 degrees
which is spoken as "1880 ohms at an angle of -57.87 degrees".
Back to Fun with Transistors.
Back to Fun with Tubes.
Back to Table of Contents.
Back to top.
2.5 RC Filter Circuits.
One of the most commonly encountered applications of a series RC circuit is a filter. Filters are used to filter out an unwanted band of frequencies which may coexist with a wanted band of frequencies. An example is the output voltage of a thermocouple which is being used to measure the temperature in a crystal-growing oven. The temperature in the oven will change very slowly and the wanted data are contained on a voltage which is changing very slowly. The frequency content will be from zero frequency (DC) to about 0.1 Hz. An unwanted frequency which is extremely likely to be present is the ubiquitous and omnipresent 60 Hz power line frequency. A filter can be designed which will reduce magnitude of the 60 Hz output to a very low level without appreciably affecting the magnitude of the 0 to 0.1 Hz data signal.Notice that word which is boldfaced above. A filter never removes an unwanted signal. There is no such thing as "remove". It's the same thing as taking a step equal to half of the distance to the wall. You can get as close to the wall as you want but you never can get there. A filter can be constructed to reduce an unwanted signal to as low an amplitude as desired but you never will be able to construct a filter to get the amplitude to zero.
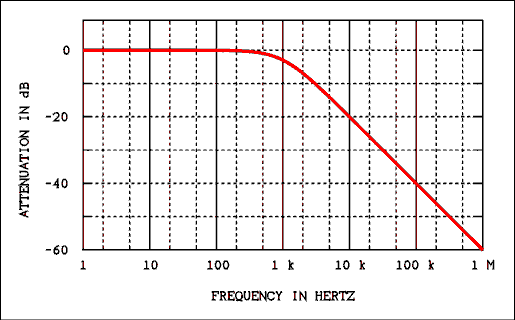
Figure 2.6 Frequency Response of a Low-pass Filter.
For a verbal description click here.
Figure 2.7 Frequency Response of a High-pass Filter.
For a verbal description click here.
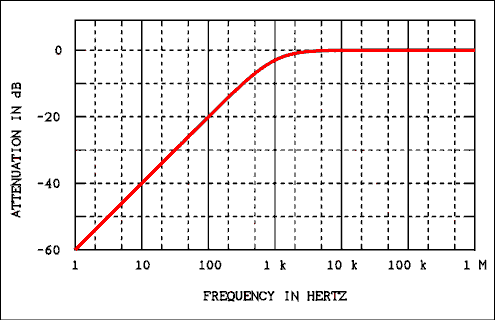
Filters can be divided into two groups, low-pass and high-pass. A low-pass filter will pass low frequencies and attenuate high frequencies. A high-pass filter will pass high frequencies and attenuate low frequencies. The dividing line between high and low is called the cutoff frequency.The term "cutoff frequency" gives a false impression about how filters work. The notion is that all frequencies on the "pass" side of the cutoff frequencies are passed and all frequencies on the other side of the cutoff frequency are removed. That impression is wrong! The cutoff frequency is defined as that frequency where the output power is down to half of the input power. Figure 2.6 shows how the output of a low-pass filter which has a cutoff frequency of 1000 Hz (1 kHz) varies with frequency. Figure 2.7 shows the frequency response of a high-pass filter which also has a cutoff frequency of 1 kHz.
Do not be concerned if you don't know what a dB is. For now all you need to know is that it is a logarithmic function of VO / VI. The dB will be explained fully in section 2.6.
You will notice in Figures 2.6 and 2.7 that each filter has a portion of its frequency response curve where the output is unchanged as frequency changes. This is called the "flat" portion of the frequency response. The portion where the output is changing with frequency is called the "roll off" part of the curve. The cutoff frequency is that frequency where the output power is down to 1/2 of the power in the flat part of the curve. That does not conflict with the statement above because (in most cases) in the flat part of the curve the output power is equal to the input power.
Using the equation P = V2 / R it can be shown that when the power is reduced by 1/2 the voltage is reduced by 0.7071 which is 1 over the square root of 2. At the frequency where XC = R the output voltage is 0.7071 of the input voltage. This will be illustrated in an example. Thus the cutoff frequency is where XC = R.
Separating AC and DC.
As you will learn in later chapters, signals in electronics are often mixtures of AC and DC. In many cases it is desired to remove one or the other. A signal may have the formv = VDC + VP sin( 2 pi f t ) (2.23) where VDC is the DC part of the signal, VP is the peak value of the AC part of the signal and f is the frequency of the AC part of the signal. Figure 2.8a shows an equivalent circuit of a DC + AC generator. Figure 2.8b is a graph of the output voltage versus time.
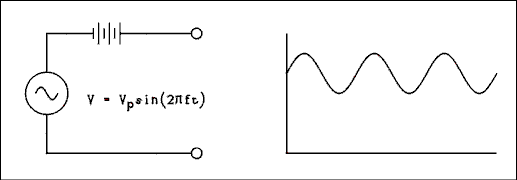
Figure 2.8 DC + AC Generator (a) and Its Output (b).
For a verbal description click here.
Figure 2.9 Low-pass Filter with Its Input and Output.
For a verbal description Click here.
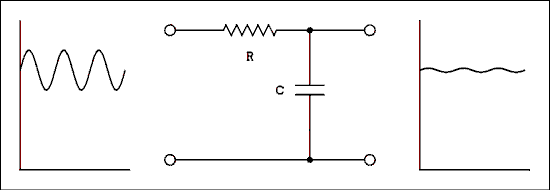
Suppose we pass this DC + AC signal through a low-pass filter as in Figure 2.9. The frequency of the AC is much higher than the cutoff frequency of the filter. That is equivalent to saying that XC is much less than R at the frequency of the AC generator. Most of the AC will be shorted out by the capacitor but the DC will be unaffected. Consequently the AC will be attenuated while the DC will not.
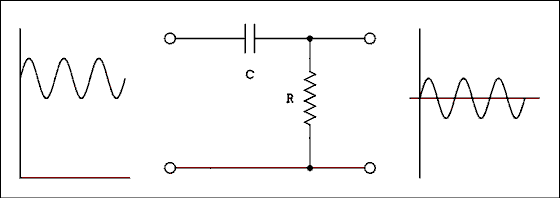
Figure 2.10 High-pass Filter With Its Input and Output.
For a verbal description click here.
Now let us pass this DC + AC signal through a high-pass filter as in Figure 2.10. The frequency of the AC is much higher than the cutoff frequency of the filter. That is equivalent to saying that XC is much less than R at the frequency of the AC generator. The AC will be affected very slightly by the filter but the DC will be totally removed. Consequently the DC will be attenuated while the AC will not. Because DC is zero frequency, absolutes do apply. The magnitude of the DC will be reduced to zero.Attenuation of Unwanted AC Signals.
It is easy to calculate the amount of attenuation a filter will introduce at any frequency. The procedure is quite similar to that used to solve a voltage divider in DC circuits.
- Calculate the capacitive reactance XC and then the circuit impedance Z.
- Calculate the circuit current using the known or an assumed input voltage and the total circuit impedance Z.
- Multiply the current by the resistance or the reactance of the element across which the output is taken.
- Determine the attenuation ratio by dividing the calculated output voltage by the known or assumed input voltage.
For those who would prefer equations they are.
For a low pass filter.
For a high pass filter. 
Calculation of phase angle is usually not necessary. 
Example 2.12.
In Figure 2.9, R = 1 k ohms and C = 10 uf. What is the attenuation ratio at a frequency of 60 Hz?Solution:First, calculate the reactance of the capacitor at 60 Hz.XC = 1/(2 pi f C) = 1/(2 pi 60 Hz x 10 x 10-6 f) = 265.26 ohms.
The circuit impedance is

Assume an input voltage of 1 v and calculate I = E / Z
I = 1 v / 1034.58 ohms = 9.6658 x 10⁻⁴ A.
VO = I XC = 9.6658 x 10-4 A x 265.26 ohms = 0.256 v. Dividing this output voltage by 1 v gives the attenuation ratio of 0.256.
Example 2.13.
In the circuit of Figure 2.10 R = 1592 ohms and C = 0.1 uf. What are the attenuation ratios at (a) 60 Hz and (b) 1 kHz?Solution:
For details on the calculations of XC, Z and I you are referred to example 2.12. Calculating XC at 60 Hz and 1 kHz we have
XC at 60 Hz = 2.653 x 10⁴ ohms and
XC at 1000 Hz = 1592 ohms.
Calculating the circuit impedance at 60 and 1000 Hz.
Z at 60 Hz = 2.658 x 10⁴ ohms and
Z at 1000 Hz = 2251 ohms.
The current for 1 v input is found to be
I at 60 Hz = 3.762 x 10⁻⁵ A and
I at 1000 Hz = 4.442 x 10⁻⁴ A.
All that remains is to calculate the output voltage. This is the only part of this example which is different from example 2.12. For Figure 2.10 the output voltage is (a) VO = I R.
At 60 Hz VO = 3.762 x 10-5 A x 1592 ohms = 5.99 x 10⁻²v.
The attenuation ratio AR = 5.99 x 10⁻²
(b) At 1000 Hz VO = 4.442 x 10-4 A x 1592 ohms = 0.707 v
therefore AR = 0.707In the above examples we have defined the attenuation ratio of a filter to be
AR = VO / VI (2.24) where VO is the output voltage of the filter at one particular frequency and VI is the input voltage at the same frequency. The output divided by the input is often called the "gain" of the circuit. The term gain implies an increase, not a decrease as occurs in a passive circuit. The term gain will make more sense when we study amplifiers which do increase the amplitude of the input signal.In the examples above if the attenuation is desired at several different frequencies it would be necessary to recalculate the value of XC for each frequency. There is a way to avoid these repeated calculations. Let us write a general equation for the attenuation ratio of a low-pass filter and see what we can do with it. The general equation is this.
Now we will make the substitution XC = 1 / (2 Pi f C). 
Now we will multiply the above equation through by 2 Pi f C to obtain. 
The cut-off frequency is where XC = R. If we substitute into the reactance equation we have 
R = 1 / (2 Pi fC C) Solving for the cut-off frequency gives.fC = 1 / (2 Pi R C). We can substitute this into the above equation and obtain.Where fc is the cut-off frequency and f is any given frequency. 
If we start from the high pass filter equation and follow the same procedure we will obtain.
Either one of these equations may easily be solved for fc to find the cut-off frequency for a given frequency and attenuation or for f to find the frequency for a given attenuation for a given filter. 
Logical Checks.
The output voltage of an RC filter will always be less than or equal to the input voltage. If you get an output which is larger than the input, you have made a mistake.For a low-pass filter, the output will decrease as the frequency increases. If asked to calculate the attenuation ratio at two different frequencies and you get an answer which says that the higher frequency gives a larger output voltage than does the lower frequency, you have made a mistake.
For a high-pass filter, the output will increase as the frequency increases. If asked to calculate the attenuation ratio at two different frequencies and you get an answer which says that the lower frequency gives a larger output voltage than does the higher frequency, you have made a mistake.
Example 2.13.1.
In the circuit of Figure 2.10 R = 1592 ohms and C = 0.1 uf. What are the attenuation ratios at (a) 60 Hz and (b) 1 kHz?Solution:
This is a repeat of Example 2.13. Lets try the new tools we have. First of all.fC = 1 / (2 Pi R C) = 1 / (2 Pi 1592 x 0.1 x 10-6) = 1000 Hz.
From equation 2.24.5 we have.
AR = 1 / sqrt(1 + (fC/f)2)
(a) AR = 1 / sqrt(1 + (1000/60)2) = 0.0599
(b) AR = 1 / sqrt(1 + (1000/1000)2) = 0.707
Example 2.13.2.
A low-pass filter is needed that has an attenuation ratio of 1.8 x 10⁻³ at a frequency of 60 Hz. (a) What is the cut-off frequency of this filter? (b) If the resistor is 1 Meg ohm what is the capacitor value?Solution:
Solving equation 2.24.4 for fc gives.

(a) Fc = 60 x 1.8 x 10-3 / sqrt(1 - (1.8 x 10⁻³)2) = 0.108 Hz.
(b) C = 1 ( 2 Pi fc R) = 1 / (2 Pi 0.108 x 106 = 1.47 uf.
Example 2.13.3.
A high-pass filter must have an attenuation of 0.966 at a frequency of 20 Hz. (a) What is the cut-off frequency, and (b) What is the capacitor if the resistor is 470 k ohms?Solution:
Solving equation 2.24.5 for fc gives.

(a) fc = sqrt(1 - 0.9662) / (20 x 0.966) = 5.35 Hz.
(b) C = 1 / (2 Pi 5.35 x 470 x 103) = 0.0633 uf.
Back to Fun with Transistors.
Back to Fun with Tubes.
Back to Table of Contents.
Back to top.
2.6 The Decibel (dB).
The decibel (dB) is one tenth of a Bell (B), as in Alexander Graham Bell. From this you might assume that the Bell and decibel have something to do with sound and you would be partly correct.The dB began life as a measure of sound pressure level. A dB is the smallest change in sound level which the human ear can detect. The key to understanding the dB is that word "change". There is no absolute zero on the dB scale.
Because the telephone converts sound to an electrical signal, an electrical definition of the dB is closely tied to the sound level definition. The electrical definition is
dB = 20 Log ( V2 / V1) (2.25) ordB = 10 Log ( P2 / P1) (2.26) where P1 and P2 are powers and V1 and V2 are voltages. The quantity which is subscripted 2 is the one to be expressed in dB and the quantity which is subscripted 1 is the chosen reference. For example the gain of an amplifier or loss (attenuation) of a filter can be expressed in dB as follows.dB = 20 Log (VO / VI) (2.27) Where VI is the input voltage and VO is the output voltage. In the above equations, if V2 = V1, P2 = P1 or VO = VI, the result is zero (0) dB. The denominator of the argument of the log function is called the reference level because it determines where the zero on the dB scale will be placed.The reference level may be anything which the occasion demands. There are far too many standard references to list here but there is one which is so common that it is worth mentioning. A standard reference is 1 milliwatt in 600 ohms. The voltage is V2 = P R = 1 x 10-3 w x 600 ohms = 0.60 square volts and V = 0.7746 v. This dB scale is referred to as the dBm (dB referred to 1 milliwatt) scale and it appears on most analog AC meters. It is also known as the VU (volume unit) scale. The VU meters in a tape deck or radio station console use this scale.
The dB is widely used because its logarithmic nature permits it to express a wide range of values in a compact form. It is most useful in graphing quantities which have a wide range. This will become apparent in the next section.
Example 2.14.
Express the following power levels in dBm: (a) 25 microwatts, (b) 1 milliwatt, (c) 1 watt and (d) 75 watts.Solution:
dBm = 10 Log P / 1 mw (2.28)
(a) -16.0 dBm,
(b) 0 dBm,
(c) 30 dBm and (d) 48.8 dBm.Example 2.15.
Express the following voltage levels in dBm: (a) 5 microvolts, (b) 2 millivolts, (c) 6 volts and (d) 120 volts.Solution:
dBm = 20 Log V / 0.7746 v (2.29)
(a) -103.8 dBm,
(b) -51.8 dBm,
(c) 17.8 dBm and
(d) 43.8 dBm.Example 2.16.
A filter is being operated at its cutoff frequency. (a) Use power to express the attenuation ratio in dB. (b) Use voltage to express the attenuation ratio AR in dB.Solution:
At the cutoff frequency the output power is 1/2 of the input power and the output voltage is 0.7071 of the input voltage.
(a) dB = 10 Log 0.5 = -3.01 dB.
(b) dB = 20 Log 0.7071 = -3.01 dB.
Let's call them both -3 dB.At the cutoff frequency the filter's output is 3 dB down from its flat response output level. The cutoff frequency is often called the "3 dB point" or the "half-power point".
Example 2.17.
Express the results of examples 2.12 and 2.13 in dB.Solution:
The result of example 2.12 is AR = 0.256. Since AR = VO / VI we have dB = 20 Log AR = 20 Log 0.256 = -11.8 dB.The results of example 2.13 are at 60 Hz AR = 5.99 x 10⁻² and at 1000 Hz AR = 0.707. At 60 Hz ARdB = -24.4 dB and at 1000 Hz ARdB = -3 dB.
Example 2.18
In the frequency response curve of Figure 2.6 the attenuation at 1 MHz is 60 dB, at 100 kHz it is 40 dB, at 10 kHz it is 20 dB and at 1 kHz it is 3 dB. What is the value of AR at each of these frequencies?Solution:
Starting from the equation dB = 20 Log AR and taking the antilog of both sides we haveAR = 10dB/20.
At 1 MHz AR = 10-60/20 = 1 x 10⁻³,
At 100 kHz AR = 10-2,
at 10 kHz AR = 10-1, and
at 1 kHz AR = 10-3/20 = 0.708, which shows that there are often errors in reading graphs.Back to Fun with Transistors.
Back to Fun with Tubes.
Back to Table of Contents.
Back to top.
2.7 Graphing Frequency Response.
As with most other things there is a right way and several wrong ways to graph frequency response curves. First we will discuss what makes a "good" graph in general and then show some examples of wrong ways to graph frequency response.The best possible graph is a straight line. It is easy to draw, easy to pick off values from and easy to fit an equation to. If you can't get a single straight line, a couple of line segments joined by a short curving section is the next best thing. The graphs in Figures 2.6 and 2.7 fit the latter description nicely.
One of my professors once said, in jest I'm sure, "If you can get your data to plot as a straight line you should get your PhD on the spot, and if you can get the line to go through the origin you should get the Nobel prize."In Figures 2.6 and 2.7 the frequency is plotted on a logarithmic scale. The distance between 1 and 10 is the same as the distance between 10 and 100, which is also the same as the distance between 100 and 1000. On a linear scale the distance between 10 and 100 would be 10 times larger than the distance between 1 and 10. The first dotted vertical line to the right of 1 is for 2. The next dotted line is for 5. The two dotted lines to the right of 10 are for 20 and 50 respectively. Other interpolation markings have been omitted to keep the graph from being too cluttered.
The vertical scale in Figures 2.6 and 2.7 is plotted in dB. Now that you know what a dB is you know that the vertical scale is also a logarithmic scale. If you think back to geometry you will remember that if you plot y = 1/x on a log-log scale it is a straight line. The roll-off portion of the graph of a low-pass filter is a 1/f curve, as shown in Figure 2.6. In Figure 2.7 the straight part of the roll-off is a simple y=x function which is a straight line on a log-log as well as a linear graph.
Some Wrong Ways.
Given a set of data and told to "go and plot it" with no further instructions the natural thing to do would be to use linear axes for both x and y coordinates. Figure 2.11 shows data for a low-pass filter which has been plotted on linear scales for frequency and attenuation ratio. Note that we are not using dB but just the values of AR. Because the raw data goes from 1 hertz to 1 megahertz the frequency scale is from 0 to 1 megahertz. The attenuation scale is from 0 to 1.As you can see from Figure 2.11 the frequency response curve is a shy little thing that attempts to hide behind the X and Y axes. It is not very useful because it would be impossible to pick values from except in a very small part of the curve.

Figure 2.11 Frequency Response of a Low-pass Filter
Plotted on Linear Scales 0 to 1 MHz.
For a verbal description click here.
The curve can be pulled away from the edges by changing the scale. Figure 2.12 shows the same data plotted from 0 to 6 kilohertz. While this scale throws away most of the data it does make for a readable graph.
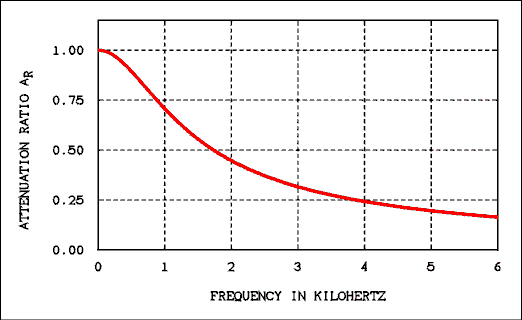
Figure 2.12 Frequency Response of a Low-pass Filter
Plotted on Linear Scales 0 to 6 kHz.
For a verbal description click here.
What is needed is a scale which allows wider spacing of numeric intervals when the values are small and closer spacing when the values are large. That sounds like the description of a logarithmic scale. Figure 2.13 is getting better because the frequency is now on a log scale. The vertical axis is still the attenuation ratio which ranges from 0 to 1. It is a linear scale.
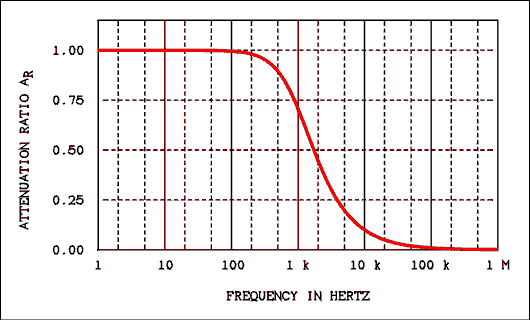
Figure 2.13 Frequency Response of a Low-pass Filter
Plotted on Logarithmic Scales 1 Hz to 1 MHz.
For a verbal description click here.
From this figure it is possible to tell that the attenuation ratio is 0.707 at 1 kHz. Inspection of this graph indicates that the output of the filter is zero above 100 kHz. This is not the case! The output of a filter never goes to zero. We are in need of a logarithmic scale for the attenuation ratio as well as the frequency.A log scale for the attenuation ratio could be obtained by using log-log graph paper to plot the data. Alternatively, we could simply take the log of AR but since the dB is so well known it seems to be the best way to get a log scale on the vertical axis. As all analog AC voltmeters have a dB scale the data may be taken in dB for plotting directly on a graph.
In Figure 2.6 we can see that the filter's output is down 3 dB at 1 kHz. We can also see that the output is down 20 dB at 10 kHz, 40 dB at 100 kHz and 60 dB and 1 MHz. In fact the output of a low-pass filter decreases by 20 dB for every decade increase in frequency. This particular rate of decrease is specific to a low-pass filter consisting of one capacitor and one resistor. Filters which are more complex will have roll-off rates of 40, 60, 80, and so on dB per decade of frequency.
Using Store-bought Graph Paper.
Many students become confused when they set out to plot a frequency response curve on a piece of semi-log graph paper. To begin with the numbers are printed on the paper in the wrong orientation. To read the numbers right-side-up you will hold the paper so that the log axis is vertical. As you can see in figure 2.6 the log axis is horizontal. Even after getting the paper turned the right way, there is still confusion about what to do with those numbers and how to relate them to frequency.Semi-log and log-log graph paper is sold by cycles. One cycle will cover one decade of data. A representation of a piece of 2 cycle semi-log paper is shown in Figure 2.14. The numbers have been turned right-side-up for easier reading.
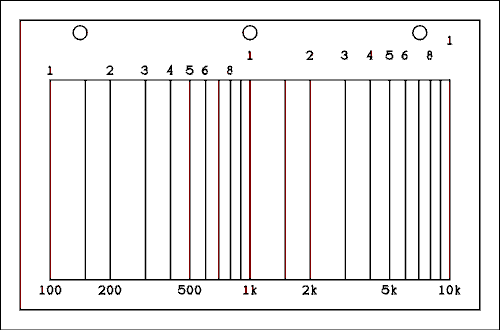
Figure 2.14 Representation of a Piece of Semi-log Graph Paper.
For a verbal description click here.
The numbers across the top are the numbers which are printed on the paper. The numbers in each successive decade are spaced a little farther out from the graph. The line between 1 and 2 is for 1.5. You may have noticed that it is not equidistant between 1 and 2. That is the nature of a log scale.To plot frequency on this graph paper you would label the horizontal axis as shown along the bottom of the graph. If you have more decades to plot you must buy another piece of graph paper which has more cycles. When you go to the bookstore to buy semi-log or log-log paper you should know how many decades of data you have to plot.
If semi-log paper cannot be obtained in the desired number of cycles, it is possible to use linear paper and take the log of frequency. The log of frequency has no particular meaning (there is no equivalent to the dB for frequency), which makes it necessary to label the graph with frequency in hertz rather than log of frequency.
The magnitude (Y axis) of a frequency response plot may be plotted on a linear scale in dB or on a log scale in attenuation ratio. Although either way is acceptable, plotting dB on a linear scale is by far the most commonly used method.
Back to Fun with Transistors.
Back to Fun with Tubes.
Back to Table of Contents.
Back to top.
2.8 Nonsinusoidal Waves.
As shown in Figure 2.1 there are waves other than sine waves. These other waves are made up of sine waves in combination.Sinusoids.
The simplest of oscillators, (devices which generate waves), produces a sine or cosine function. When the output of such an oscillator is plotted versus time, the result is what we call a sine wave. When a waveform is not sinusoidal (square, triangular or just not a sine wave), it can be shown mathematically and physically to be the sum of several sinusoidal waves.Harmonics.
A harmonic is a frequency which is an integer multiple of another frequency. The "other" frequency is called the fundamental frequency. Thus a complex (nonsinusoidal) waveform is made up of a fundamental frequency, which is a sine wave with the largest amplitude and lowest frequency, and several other sine waves which are lower in amplitude and integer multiples of the fundamental frequency.Numbering Harmonics.
Harmonic numbers are assigned on the basis of their relationship to the fundamental frequency. The fundamental frequency itself is the first harmonic. The frequency which is twice the fundamental frequency is called the second harmonic. The frequency which is three times the fundamental frequency is called the third harmonic and so on. The frequency of any harmonic is just the harmonic number multiplied by the fundamental frequency.Fourier Series.
Remember the angular frequency? The symbol usually used for the angular frequency is a lower case omega. That symbol does not appear on my word processor. We will use instead a "w". If we call the nonsinusoidal wave F(wt) then the general form of the Fourier series for F(wt) is given byF(wt) = a0 + a1 cos(wt) + a2 cos(2wt) + ... + an cos(nwt)
+ b1 sin(wt) + b2 sin(2wt) + ... + bn sin(nwt) (2.30)where w = 2 pi f, a0 is the DC component (if any) of the complex wave, an is the coefficient of the nth cosine harmonic and bn is the coefficient of the nth sine harmonic. The coefficients are given by


A square wave which has voltage levels of +V volt for the first half-cycle and -V volt for the second half-cycle and frequency w/(2 pi ) will have the Fourier seriesThe Fourier series for a triangular wave which has a positive peak voltage of +V volts and a negative peak voltage of -V volts is 
When the writer was a student, a waveform had to be capable of being described mathematically in order to obtain its Fourier series. Calculating the coefficients was a long and arduous process. Now there are computer programs which will give the coefficients of the Fourier series of any arbitrarily-shaped wave. 
The Physics of It All.
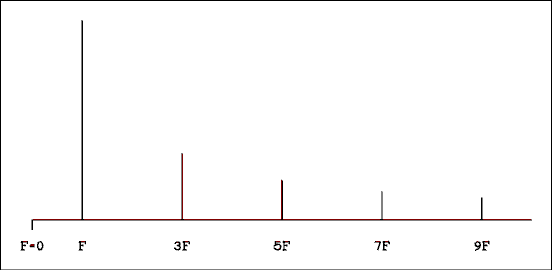
Figure 2.15 Frequency Spectrum of a Square wave.
For a verbal description click here.
Figure 2.15 shows the spectrum of a square wave. Unlike spectra you are accustomed to seeing, this one plots frequency instead of wavelength. Also unlike other spectra you may have seen, the magnitude of each line is plotted upward from the horizontal axis. In optical spectra, the magnitude of each line is indicated by its brightness in a spectroscope or its darkness on a film negative. Other than that it's a perfectly normal spectrum.Figure 2.16 shows how the sine waves fit together to make up a square wave. Notice that the square wave gets better as more harmonics are added. To obtain a perfect square wave it would be necessary to have an infinite number of harmonics. A quite good square wave is generated if approximately 99 harmonics are present.
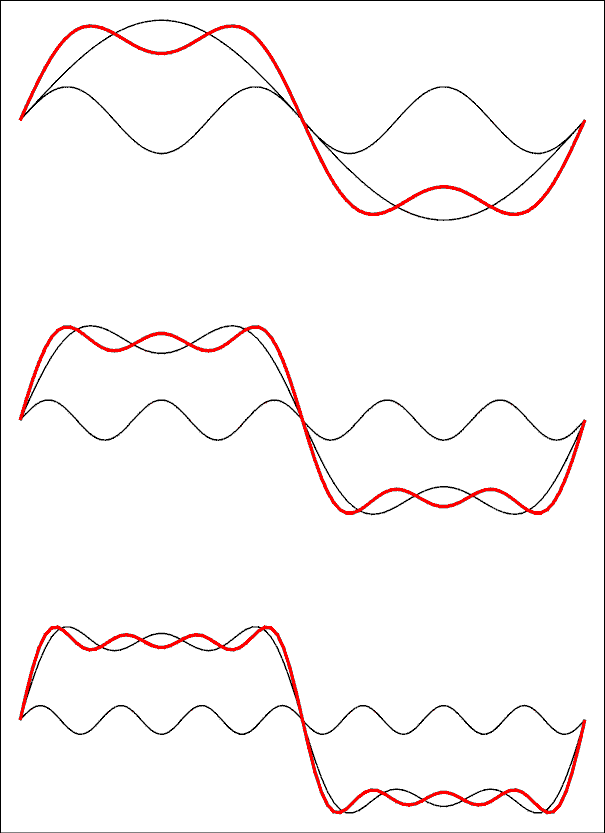
Figure 2.16 Square Waves Are Built Up from Sine Waves.
For a verbal description click here.
In the top wave the red line is the sum of the first and third harmonics. In the middle diagram the sum of 1 and 3 has been redrawn in black and the 5th harmonic added. Similarly, in the bottom diagram the 7th harmonic has been added. The more harmonics are added, the flatter the sum will be and the steeper the rises and falls will be.Back to Fun with Transistors.
Back to Fun with Tubes.
Back to Table of Contents.
Back to top.
2.9 The Effects of RC Circuits on Nonsinusoidal Waves.
When a nonsinusoidal wave is passed through an RC filter the shape of the wave is changed. An RC circuit cannot affect the shape of a lone sine wave. It can only affect its amplitude.There are two different ways to look at the way in which an RC circuit changes the shape of a nonsinusoidal wave. One is to look at the way an RC circuit affects the amplitudes and phases of the harmonics (frequency domain) and the other is to look at the RC circuit as having a time constant which superimposes its own charging and discharging on the original wave (time domain).
The Frequency Domain.
Because an RC circuit affects the amplitudes of the various harmonics of a complex waveform by different amounts, the makeup of the Fourier series is changed. If you change the Fourier series, you change the shape of the wave.Figure 2.17 shows how a square wave is modified by being passed through a low-pass RC filter. In Figure 2.17a the cutoff frequency of the filter is 10 times the frequency of the square wave. Harmonics 1, 3, 5, 7 and 9 are passed with little or no attenuation. Harmonics numbers 11 and higher are not removed; they are reduced in amplitude compared to what they were in the original wave. In Figure 2.17b the frequency of the square wave is equal to the cutoff frequency of the filter. All of the harmonics are altered in amplitude. As you can see the wave no longer looks much like a square wave. It should be pointed out that the wave has been turned on for some time, we only started looking at it where the wave seems to start. Starting and stopping transience are not shown.
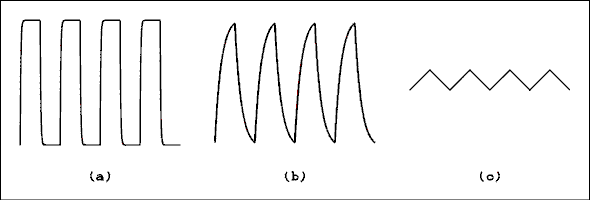
Figure 2.17 RC Filter's Effects on a Square wave.
For a verbal description click here.
In Figure 2.17c the vertical scale has not been changed. The square wave has been changed into a triangular wave of somewhat reduced amplitude. The filter has imposed its own 1 over f function on the harmonics of the square wave. The harmonic amplitudes of the wave are now a 1 over f squared function. Look at the Fourier series for a triangular wave and you will see that it is a 1 over f squared function. The square wave has been converted into a triangular wave.The analysis of other waveforms is not as easy as for a square wave but the principle is the same. In general a low- pass filter will tend to round off the sharp edges on any wave.
Figure 2.18 shows how a square wave is modified by being passed through a high-pass RC filter. In Figure 2.18a the cutoff frequency of the filter is 10 times the frequency of the square wave. Harmonics 1, 3, 5, 7 and 9 are severely attenuated with the lower numbered harmonics being attenuated more than the higher numbered ones. Harmonics numbers 11 and higher are passed with little or no attenuation. The result is a series of spikes as shown in Figure 2.18a. As with Figure 2.17, starting and stopping transients are not shown.
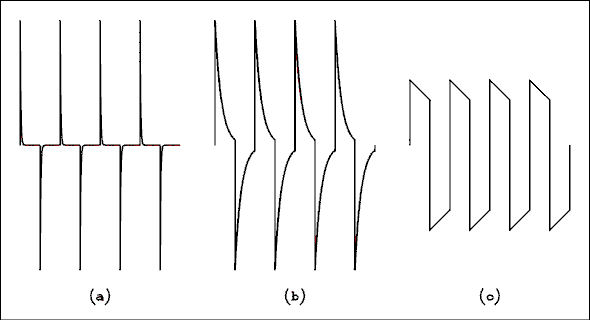
Figure 2.18 RC Filter's Effects on a Square wave.
For a verbal description click here.
In Figure 2.18b the cutoff frequency of the filter is equal to the fundamental frequency of the square wave. The fundamental frequency (first harmonic) of the wave will be attenuated by 3 dB while the higher harmonics will be affected very slightly. In Figure 2.18c the frequency of the wave is 10 times the cutoff frequency of the filter. The first harmonic will be affected by only about 10%. Figures 2.18b and 2.18c show how sensitive a square wave is to the amplitude of its fundamental frequency.The Time Domain.
In Figure 2.17 a square wave is being passed through an RC low-pass filter. When the input wave changes states, say from -V to +V, the capacitor must charge up from -V to +V. As you will remember it takes one time constant for the voltage to reach 36.8% of the final value. Theoretically, the voltage will never reach the final value.In Figure 2.17a there are 31.4 time constants in every half cycle of the square wave. This means that the capacitor has plenty of time to charge up to the final value. The difference between the final value and the charge on the capacitor is 2.27 x 10⁻¹⁴. In Figure 2.17b there are only 3.14 time constants in each half cycle. The capacitor has much less time to finish charging before the square wave switches to its other state. Even so the voltage will have time to reach 95.7% of its final value. In Figure 2.17c there is only 0.314 of a time constant in each half cycle of the square wave. The voltage will only reach 26% of its final value. For small values of x the equation y = e-x appears to be a straight line. That is why the square wave is converted into a triangular wave.
The time integral of a square wave is a triangular wave. RC low-pass filters are often called integrators because they can be made to integrate waves if the frequency of the wave is higher than the cutoff frequency of the filter.
If a square wave is passed through an RC high-pass filter the results are shown in Figure 2.18. In Figure 2.18a there are 31.4 time constants in every half cycle of the square wave. This means that the capacitor has plenty of time to discharge. The charge on the capacitor is 2.27 x 10⁻¹⁴ of its starting value. In Figure 2.18b there are only 3.14 time constants in each half cycle. The capacitor has much less time to finish discharging before the square wave switches to its other state. Even so the voltage will have time to reach 4.3% of its initial value. In Figure 2.18c there is only 0.314 of a time constant in each half cycle of the square wave. The voltage will fall to 73% of its initial value.
RC high-pass filters are often called differentiating circuits because they do an approximate differentiation on the input wave. The slope of a square wave is 0 along the flat portions of the wave and very high on the transitions. Thus the derivative of a square wave is a series of narrow spikes similar to Figure 2.18a.
The fact that the same set of figures was used for both time domain and frequency domain discussions should make it clear that these are simply two different ways of describing the same phenomenon. The physics goes on regardless of the human reasoning process or even in the total absence of human reasoning.
Back to Fun with Transistors.
Back to Fun with Tubes.
Back to Table of Contents.
Back to top.
2.10 R-LC Resonate Circuits.
When inductance and capacitance exist together in the same circuit the phenomenon of resonance appears. You are already familiar with resonance in a spring-mass system. If such a mechanical system is driven by an external force at different frequencies it will respond most strongly when driven at its resonant frequency. If the system is displaced and then released, it will produce damped oscillations at its resonant frequency. How rapidly the oscillations damp out will depend on the amount of energy lost in the system.An R-LC circuit will respond electrically in exactly the same way as the mechanical system. If an external AC voltage is applied to the circuit at different frequencies, the current in the circuit will be largest at the resonant frequency. If a DC voltage is applied to the circuit and then suddenly removed, the circuit will produce damped oscillations at its resonant frequency. How rapidly the oscillations damp out will depend on the amount of resistance in the circuit.
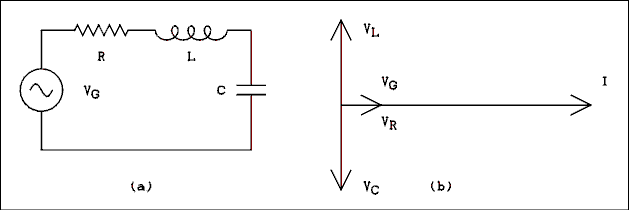
Figure 2.19 (a) R-LC Resonant Circuit and (b) Phasor Diagram.
For a verbal description click here.
A series R-LC circuit is shown in Figure 2.19a and its phasor diagram is shown in Figure 2.19b. The current everywhere in the circuit will be in phase with itself. The voltage across the resistor will be in phase with the current. The voltage across the inductor will lead the current by 90 degrees while the voltage across the capacitor will lag the current by 90 degrees. As can be seen in Figure 2.19b the total difference in phase between VC and VL is 180 degrees. IF the two voltages are equal in magnitude, they will cancel out and the voltage across the resistor will be equal to the generator voltage. Whereas IC = IL, the only way to make VC = VL is to have XC = XL. This is the definition of the resonant condition in a series circuit. Series resonance occurs when the capacitive reactance is equal to the inductive reactance.The total impedance of a series R-LC circuit is
where R is the resistance of the resistor in ohms, XL is the reactance of the inductor in ohms and XC is the reactance of the capacitor in ohms. If we substitute XL = 2 pi fL and XC = 1/(2 pi fC) we have 
where f is the frequency in hertz, L is the inductance in henrys and C is the capacitance in farads. With R, L and C held constant Z will be infinite at f = 0 and infinity. For values of f between zero and infinity, Z will come down to a minimum of Z = R at the resonate frequency. Figure 2.20 shows impedance versus frequency and current versus frequency for a 1 volt generator, a 50 ohm resistor, a 79.6 millihenry inductor and a 0.318 microfarad capacitor connected as in figure 2.19a. The curves of resonant circuits appear on linear scales about as often as they appear on log scales. 
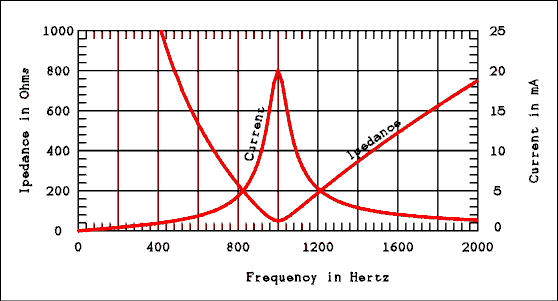
Figure 2.20 Impedance and Current Versus Frequency.
For a verbal description click here.
Resonant circuits are used to select a narrow band of frequencies out of the entire frequency spectrum. Just how narrow a band is selected depends on the quality factor "Q" of the circuit.Bandwidth and Q of Resonant Circuits.
The bandwidth of a resonant circuit is defined as the difference between the two frequencies where the current is down to 0.707 of its maximum value (the half power points). Remember that 0.707 is our old friend -3 dB. This may seem to be a somewhat arbitrary definition. However as we will see soon if we start with the -3 dB points we can derive the equation for Q given below. The derivation could be done the other way as well. In the circuit of Figure 2.20 the maximum circuit current is 20 mA. The current at the -3 dB point is 14.14 mA. Notice that there are two -3 dB points on the curve at frequencies of 952 and 1052 hertz. *The lower -3 dB frequency is called f1, the upper -3 dB frequency is called f2 and the resonant frequency is called fR. The quality of a resonant circuit may be expressed as
* These frequencies were found by placing a conditional test in the plot program and causing the frequencies to be printed out. In this sense the values were "picked off of" the graph. The nature of the program rounded off the frequencies which is why these values are different from the ones given below to more significant digits.
Q = fR / (f2 - f1) (2.38) The Q or quality factor of a resonant circuit can also be expressed as follows:Q = XL / R or Q = Xc / R (2.39) Q is defined at resonance where XL = XC. Equation 2.39 is derived from a definition and will be shown below.\ The most fundamental definition of Q is,
Q = (energy stored on each signal cycle) / (energy lost during 1 radian of the cycle). One radian is the basic unit of time in AC mathematics. Read the equal sign as the three line sign meaning "is defined as". Here is how we get from the above definition to the one we all know and love.
Starting with a series resonant circuit the energy stored is continuously swapped back and forth between the inductor and capacitor. From fundamental electricity we know that the energy stored in a capacitor and an inductor are,
WC = V^2 C / 2 And
WL = I^2 L / 2
Where W is the amount of energy stored in either the capacitor or inductor according to the subscript, V is the voltage across the capacitor, C is the capacitance of the capacitor, I is the current through the inductor, and L is the inductance of the inductor. The stored energy is being traded between the inductor and capacitor and It may be hard to get a handle on it. What we must do is to order time to stop at the instant when the energy in the inductor is at its maximum value. Since this is a thought experiment we don't need a DeLorean to make that happen. We stop time at the peak value of the current. Since this is a series circuit by Kirchhoff's law the current is the same in all components. In our simple circuit the energy lost is dissipated by the resistor and we can write,
WL = (IP^2 L) / 2 We need the two currents to be the same so they will cancel out in the final equation.And
PR = IRMS^2 R
IRMS = IP / sqrt(2) Substituting for IRMS into the equation for PR gives.
PR = (IP / sqrt(2) )^2 R. Since (sqrt(2))^2 = 2 we have,
PR = IP^2 R / 2. Energy = Power times Time so as explained above we need to find the energy dissipated by the resistor in one radian of time. One radian is the period, time for one cycle given as the symbol T, of the wave divided by 2pi because there are 2 pi radians in one cycle. Furthermore the period, T = 1/ f so one radian = 1 / (2 pi f). Where have we seen that one before?
So, the energy dissipated in a resistor in 1 radian of time is,
WR = IP^2 R / (4 pi f) Now if we divide WL by WR we have,
Q = (IP^2 L / 2) / (IP^2 R / (4 pi f)) Lets do some obvious canceling.
Q = L / (R / (2 pi f)) Inverting the divisor and multiplying gives,
Q = 2 pi f L / R Since 2 pi f L = XL we have,
Q = XL / R. So now we have a proven formula for calculating Q based on the reactance of the inductor at the resonant frequency and the resistance of the coil. Now we need to show the relationship between the two equations for Q which were given above.
To do this we first find the two frequencies f1 and f2 where the current is down to 1 / sqrt(2), 0.707, -3 dB, referenced to the current at the resonant frequency, fr. This derives from this equation.
Where fr is the resonant frequency, peak of the curve above, f1 is the lower 0.707 point, and f2 is the upper 0.707 point. We will derive expressions for f1 and f2 and then using nothing more than algebra arrive at, Q = fr / (f2 - f1)
We can simplify the math a bit by removing reference to the current and the applied voltage and work directly with the impedance Z. If the voltage is constant and the current is down to 1 / sqrt(2) the impedance must be up to sqrt(2). Q = XL / R
Resonance is defined as the frequency where XL = XC or 2 pi f L = 1/(2 pi f c). In the equation for impedance above if the condition of resonance is met the second squared term under the radical will be zero. Thus the impedance Z will be Z = sqrt(R^2) = R. For the impedance to be sqrt(2)R the second term must be equal to R. Thus,
Z = sqrt(R^2 + R^2) = sqrt(2R^2) = sqrt(2)R. Using the simpler form of impedance we write,
Z = sqrt(R^2 + (XL - XC)^2) By inspection we can see that if XL increases by 0.5 R and XC decreases by 0.5 R the impedance will be sqrt(2)R. Just one little problem. XL and XC don't change at the same rate. The graph of XL versus frequency is a straight upward sloping line wile the graph for XC versus frequency is a parabola. If we look at a parabola over a small enough frequency span it looks like a straight line but when the Q of the circuit is low this approximation no longer holds.
So we set the reactance expressions at f1 and f2 equal to R and ignore the radical as follows. The equations below are based on the rule "If a^2 = b^2 then a = b" except for a slight matter of signs which we will be aware of as we write the equations.
The frequency f1 is below the resonance point and the inductive term is smaller than the capacitive term so R must be negative to be equal to the reactive term. The frequency f2 is above the resonance point and the inductive term is larger than the capacitive term so R must be positive to be equal to the reactive term. In the impedance equation squaring the terms takes care of signs and we don't have to be concerned about them. In these equations we do. Now we multiply through by 2 pi fC in both equations. -R = 2 pi f1 L - 1 / (2 pi f1 C)
And
R = 2 pi f2 L - 1 / (2 pi f2 C)
Now we rearrange these equations to get them into the classic quadratic form. -2 pi R C f1 = 4 pi pi L C f1^2 - 1
and
2 pi R C f2 = 4 pi pi L C f2^2 - 1
The next step is to plug the values into the quadratic formula and turn the crank. But I wanted some kind of check on the reliability of these equations. I used the example that plotted the curves above. A digit has been added to the values to give greater assurance of the accuracy of the equations. -4 pi pi L C f1^2 - 2 pi R C f1 + 1 = 0
and
-4 pi pi L C f2^2 + 2 pi R C f2 + 1 = 0
The Q of the circuit is given by Q = XL / R = 10. By Q = fr / (f2 - f1) , (f2 - f1) = 100 Hz. L = 79.58 millihenrys,
C = 318.3 nanofarads,
R = 50 ohms,
XL = XC = 500 ohms, and
fr = 1,000 Hz.Entering the quadratic formula into an Excel cell and spending a couple of hours trying to find the typo that kept the answer from coming out right, yielded, f1 = 951.2 Hz and f2 = 1051.2 Hz. The asymmetry of the f1 and f2 points is caused by the parabolic shape of the capacitance reactance curve which I spoke of above. Even when a resistor of 250 ohms is inserted giving a Q of 2 the bandwidth comes out right.
I used to be under the mistaken impression that the formula Q = fr / (f2 - f1) was an approximation That would fall apart at low values of Q. Also I believed it could not be derived. In fact I have never seen a derivation or proof of the validity of this formula. It's a little harder to invent the wheel when you have never seen one.
Something very important I learned from the example is that the correct answer is given by using the positive sign on the radical in the quadratic formula. When the negative sign is used the frequency is given as a negative number. Since there is no such thing as negative frequency the positive one has to be the right answer.
Well, let's grind out some more algebra. Isn't it fun?
Now we subtract f1 from f2. The denominators are the same so there is no need to worry about finding a common denominator. The radical has the same value so it will go away. The b coefficient has a different sign in the two but the squaring operation makes it all positive. So it looks like we get, X = (-b +/- sqrt(b^2 - 4ac)) / (2 a)
-4 pi pi L C f1^2 - 2 pi R C f1 + 1 = 0
f1 = (2 pi R C + sqrt((- 2 pi R C)^2 + 16 pi pi L C )) / ( -8 pi pi L C )-4 pi pi L C f2^2 + 2 pi R C f2 + 1 = 0
f2 = (-2 pi R C + sqrt((2 pi R C)^2 + 16 pi pi L C ))/ ( -8 pi pi L C)This seemingly simple equation does produce correct answers when the values from the numerical example are inserted into it. f2 - f1 = (-2 pi R C -(2 pi R C)) / ( -8 pi pi L C) = -4 pi R C )/ (-8 pi pi L C )
f2 - f1 = R / ( 2 pi L )
Now we have to divide fr by f2 - f1. This will produce the value of Q. We know that fr = 1 / (2 pi sqrt of ( L C )). What was that rule? Oh yes, invert the divisor and multiply.
Q = (( 2 pi L ) / R )( 1 / ( 2 pi sqrt(LC))
Q = (2 pi L ) / ( R (2 pi sqrt(LC)))
Q = L / (R sqrt(LC))
This equation also gives the correct numerical answer. Now, we are sorry we cancelled those 2 pi terms. Lets put them back by multiplying by (2 pi) / (2 pi)
Q = (2 pi L ) / (R 2 pi sqrt(LC))
but,
fr = 1 / (2 pi sqrt(LC)
so
Q = (2 pi fr L ) / R
Since 2 pi fr L = XL we have,
Q = XL / R
QED
Example 2.19.
What is the resonant frequency of the circuit whose curves are plotted in Figure 2.20? Calculate the Q according to both definitions.Solution:
The resonate frequency is where XL = XC. Equating these two quantities gives2 pi f L = 1 / (2 Pi f C)
Solving this equation for f gives

Substituting L = 79.6 mH and C = 0.318 uf gives the result 1000 hertz. The Q of the circuit according to equation 2.38 is Q = 1000 / (1052 - 952) = 10. The values of f1 and f2 were given on page 108. To find the Q by equation 2.39 we must first find a value for XL or XC at the resonant frequency. XL = 2 pi f L = 500 ohms. Q = X/R = 500 ohms /(50 ohms ) = 10.
Example 2.20.
Using all of the same values from the previous example, what is the voltage across the capacitor in the circuit of Figure 2.19a at the resonant frequency?Solution:
At resonance XL = XC and by equation 2.37 Z = R; therefore, I = 1 v / (50 ohms) = 20 mA. The reactance of the capacitor at resonance is XC = 1 / ( 2 pi fC ) = 500 ohms. The capacitor voltage VC = I XC = 20 mA x 500 ohms = 10 v.Notice that the voltage across the capacitor is Q times the input voltage. This is no coincidence. The voltage across the capacitor could be taken as the output voltage of the circuit. In that case only the voltages at or near resonance will be increased in amplitude. Voltages at frequencies far away from resonance will be attenuated.
One note of caution. The circuit is NOT increasing the power of the input signal. While more voltage is available, there is less current available. You don't get something for nothing.
Also you have no doubt noticed that f1 and f2 are not equally spaced about fR. Reactive circuits behave in a geometrical rather than an arithmetical manner. That is to say f2 - fR is not equal to fR - f1 but
f2 / fR = fR / f1 in this example to an accuracy of 0.15%. (The accuracy might have been better but the frequency was restricted to integer values.) The curve would be graphically symmetrical if it had been plotted on a logarithmic frequency scale. The Q of a circuit which resonates at a radio frequency can be as high as 250. The curves of such circuits cover such a small percentage of the frequency spectrum that there is no practical difference between a logarithmic and a linear scale.The Imperfect Inductor.
In the study of electric circuits we are accustomed to thinking of every component as if it were perfect. We think of wires as having zero resistance, resistors as having exactly the specified value and capacitors as having no built-in resistance. The errors which result from these implicit assumptions are not large enough to get us into very much trouble. Of the three basic circuit components - resistors, capacitors and inductors - inductors are the most imperfect. To assume that inductors possess only the property of inductance would be a very large mistake.Inductors are constructed by winding a length of copper wire on a hollow nonmagnetic, nonconducting tube (air core) or an iron bar (iron core). Other core materials are used such as powdered iron (ferrite) or brass. Both the wire and the core material introduce energy losses. When energy is lost, the effect is the same as having resistance in series with the inductor.
The copper wire actually has resistance. Certain inductors have many turns which means that the total length of wire is quite long. The amount of resistance can be significant enough to lower the Q of the circuit.

Figure 2.21 Equivalent Circuit of an Inductor.
For a verbal description click here.
The loss which is introduced by the core material also contributes to the equivalent resistance of the inductor. Any energy loss in a circuit can be accounted for by calling it resistance even though there is no measurable resistance in the circuit. A core which has losses will cause the inductor to act the same as if a lossless inductor were connected in series with a real resistor.You may be wondering why iron and material other than air are used. If the only thing a core did was to introduce losses there would be no reason to use it. An iron core will increase the amount of inductors by as much as a factor of 1000 over the same coil with an air core. The gain in inductance is well worth the increase in core loss caused by the iron.
If iron is so good, why use anything else? The reason is frequency. The common laminated iron core* is only useful through the audio frequency band (up to 20,000 Hz). Powdered iron cores are useful up to about 30 MHz. The individual grains of iron powder are held together and insulated from one another by some sort of plastic material. Brass cores are used from about 30 to 200 MHz. Above 200 MHz even air core coils have only 2 or 3 turns and a solid core is not needed to increase the inductance.
* A solid iron core is useless in AC applications because of the excessive losses due to eddy currents. In a laminated core the iron is in thin sheets and the sheets are electrically insulated from one another.
Parallel Resonant Circuits.
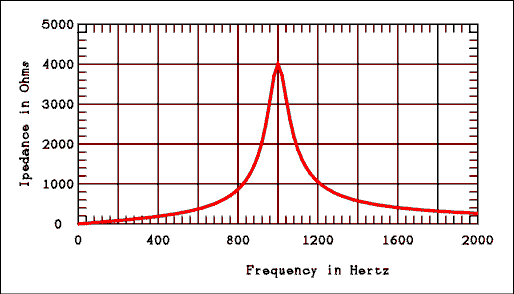
Figure 2.22 is the diagram of a parallel resonant circuit. Circuits such as this are used much more often than are series resonant circuits. The impedance versus frequency curve for this circuit is shown in Figure 2.23. As you can see, the impedance is low at the extremes of frequency and rises to a maximum value at resonance. If a parallel resonant circuit is used as the load for a transistor, the gain of the amplifier will be maximum at resonance and very low away from resonance. Such an amplifier is called a frequency-selective or tuned amplifier.
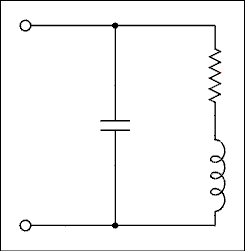
Figure 2.22 Parallel Resonant Circuit.
For a verbal description click here.
Figure 2.23 Impedance Versus Frequency for a Parallel Resonant Circuit.
For a verbal description click here.
Back to Fun with Transistors.
Back to Fun with Tubes.
Back to Table of Contents.
Back to top.
2.11 Transformers.
A transformer is a device which will change the voltage and current of AC. A transformer can be used to step down the voltage of the power line for use by circuits which would be damaged by the full 120 volts of the power line. In addition the electric utility itself uses transformers to step the voltage up and thereby step the current down to minimize the power lost in long power lines. A transformer consists of two or more coils of wire wound on an iron core. The coils are usually wound one surrounding the other. The schematic symbol for a transformer is shown in Figure 2.24. The winding to which power is applied is called the primary winding and the winding from which the power is taken is called the secondary winding. Many transformers have more than one secondary winding.
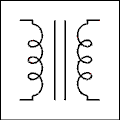
Figure 2.24 Symbol for a Transformer.
For a verbal description click here.
To determine quantitatively how the voltage is changed by a transformer we must remember the equationwhere E is the voltage across the coil, N is the number of turns on the coil and Phi is the magnetic flux linking the coil. For the two windings of a transformer we can write 
where the subscript P refers to the primary and the subscript S refers to the secondary. In a transformer the magnetic flux is so well confined by the iron core that almost all of the flux from the primary also links the secondary and visa versa. This means that Phi sub P = Phi sub S. We can divide equation 2.42a through by NP and equation 2.42b by NS and set them equal and rearrange terms to obtain the following equation. 
EP / ES = NP / NS (2.43) Example 2.21.
A transformer has 2450 turns on its primary and 700 turns on its secondary. If 120 volts is applied to the primary, what is the secondary voltage?Solution:
The secondary voltage is ES = EP NS / NP = 120 x 700 / 2450 = 34.29 volts.Example 2.22.
In the case of the transformer from example 2.21 if the secondary current is 850 mA, what is the primary current?Solution:
Transformers are so efficient that the efficiency may be taken as 100% without introducing serious errors. Therefore, the power in the secondary equals the power in the primary. PP = PS and EP IP = ES IS; therefore,A transformer which steps up the voltage will step down the current and vise versa. An electric utility will use transformers to step up the voltage to a very high value (as much as 300 kv) to send power over very long distances. When the voltage is stepped up, the current is stepped down. Most of the loss in power transmission lines is due to the resistances of the wires. Making the current as small as possible will minimize the power loss due to resistance. The voltage is stepped back down for distribution around cities and stepped down again just before being delivered to the customer.IP / IS = ES / EP (2.44)
and so IP = 850 mA x ( 34.29 v / 120 v ) = 243 mA.
From equation 2.44 you might properly deduce that
IP / IS = NS / NP (2.45)
Impedance Transformation.
A note about terminology
The term "impedance" is often used when the term resistance could be applied. This is correct usage because of the way in which impedance is defined. Impedance is a combination of resistance and reactance. The reactive component may or may not be zero. Therefore, it is possible to say "impedance" and mean "resistance". The reverse of this is not correct.The apparent impedance of the primary of a transformer is given by ZP = EP / IP and the impedance in the secondary is ZS = ES / IS. If we substitute equations 2.43 and 2.45 into these impedance equations we have
Inverting the denominator and multiplying we have. 

Example 2.23
What is the turns ratio of a transformer to match an 8 ohm speaker to a 600 ohm line?Solution:
Since power goes to a speaker, the 8 ohm speaker side is the secondary of the transformer. The power flows from the transformer to the speaker.True, the number of turns must be an integer. A transformer manufacture would use many turns possibly 866 / 100 or more likely 8660 / 1000. Since we are working problems and not manufacturing transformers we can be content with what ever number comes out, even a number less than one.

Back to Fun with Transistors.
Back to Fun with Tubes.
Back to Table of Contents.
Back to top.
2.12 The Oscilloscope.
Almost all voltmeters have ranges designed for measuring AC voltage. Most DMMs have ranges for measuring AC current. If sine waves are involved, most voltmeters and ammeters will read out only the RMS value of the voltage or current. The limitations of voltmeters and ammeters are many. They cannot tell us anything about the waveform, the frequency, the phase or noise content of the AC signal being measured. Indeed, if the waveform is other than a sine, if the frequency is too high or if the signal contains too much noise, common AC voltmeters and ammeters will give us false readings.The most useful instrument for making measurements on AC signals is the oscilloscope. The oscilloscope can be used to make quantitative measurements of voltage, frequency, rise-time of a square wave and phase between two signals. In addition an oscilloscope can be used to make qualitative evaluations of waveform and noise content. But that's not all. With various electronic and computer add-ons an oscilloscope can display the characteristic curves of semiconductor devices, plots of frequency response, phase diagrams of complex signals and frequency spectra and logic states (1s and 0s) in a microprocessor system. If you had to do electronics in a remote area of the earth or in space and you could take only one measurement instrument, the oscilloscope would be the unquestioned choice.
An oscilloscope is basically two instruments in one: a voltmeter and a time interval meter. The voltmeter portion is usually the Y axis, although the X axis may be used in some oscilloscopes for some special applications. The time interval portion is always the X axis.
The thing which sets the oscilloscope apart from all other electrical measurement instruments is the cathode ray tube (CRT). The CRT is one of the few vacuum devices which has not been replaced by a solid state equivalent. (For some years now the solid state replacement has been promised but so far it remains only a promise.)
BINGO! That promise has at last been fulfilled. I have, at this moment, sitting on my workbench an oscilloscope which has a front panel the same size as any classic scope but instead of being seventeen and a half inches deep it is four and a half inches deep. The CRT has been replaced by a liquid crystal display. Granted, at this writing, 2006, they are still rather pricy. But knowing the electronics industry, the price will come down and the CRT will fall out of favor, except for a small number of diehards who will insist that the CRT just looks better. I have to concede that is true but the advantages still outweigh the disadvantages. The following section on the CRT will be left in until this tube completely disappears from the scene.
The Cathode Ray Tube.
A simplified, two-dimensional drawing of a CRT is shown in Figure 2.25. Electrons are emitted from the heated cathode and are formed into a fine beam and raised to a high velocity by the accelerating electrode assembly. When the electron beam strikes the screen, a small dot of light appears. The color of this light depends on the material used in the screen.Between the electron "gun" and the screen are two pairs of deflection plates. One pair is for deflecting the electron beam in the horizontal plane and the other set deflects the beam in the vertical plane.
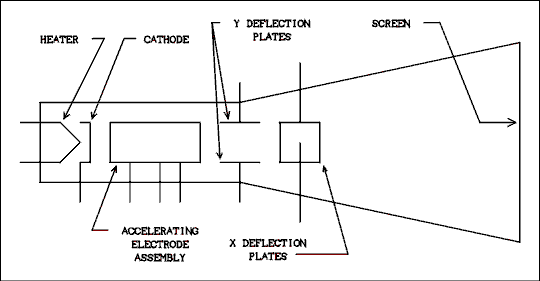
Figure 2.25 Simplified, Two-dimensional Drawing of a CRT.
For a verbal description click here.
If the potential difference between the deflection plates is zero, the beam will fall in the center of the screen. Suppose that we make the top Y deflection plate positive with respect to the bottom one. Since like charges repel and unlike charges attract, the electron beam will be bent upward on its way to the screen and will strike the screen above the center. If the potential is reversed, the beam will be bent downward. The X deflection plates work in the same way to bend the beam in the horizontal plane. The voltage between the deflection plates is quite large, usually about 50 volts to move the dot one inch.A block diagram of an oscilloscope is shown in Figure 2.26. We will briefly discuss each block. Because we have not yet studied amplifiers, we cannot look at specific circuits in this chapter.
The Vertical Amplifier.
Because of the high voltage required to deflect the electron beam, it is necessary to include an amplifier in an oscilloscope. As shown in the block diagram of Figure 2.26, the amplifier is between the Y input and the Y deflection plates of the CRT. The amplifier includes range switches to permit measurement of voltages from very small (1 millivolt) to somewhat large (100 volts). There is also a control to allow the operator to position the display anywhere on the screen (or even off of it). Some oscilloscopes have switches for reversing the polarity of the signal (turning the display upside down).The vertical input is not only to look at the pretty picture. It can be used to measure voltage. There is a range switch which is calibrated in volts per division on the screen. This allows the oscilloscope to be used as a voltmeter to measure unknown voltages.
The Time Base.
In order to plot voltage versus time (which is what an oscilloscope does best), it is necessary to move the dot of light across the screen at a constant velocity. This is done by placing a ramp voltage on the horizontal deflection plates. A ramp voltage is one which is increasing at a constant rate and would have the equation V = Kt where K is a constant. Plotted versus time, such a voltage will be a straight upward-sloping line. The time base is often called the "sweep" because the electron beam is swept across the screen. The sweep is calibrated in time per division on the scope screen and a switch selects the various sweep rates.The dot of light begins at the left edge of the screen and is swept across to the right edge. Before the sweep is returned to its starting point, the electron beam is turned off to darken the dot so that the return sweep will not be visible and confuse the operator. The beam retraces to the left hand edge of the screen in a small fraction of the time required to sweep from left to right. Upon reaching the left edge of the screen, the electron beam is turned on again and the dot begins another trip across the screen.
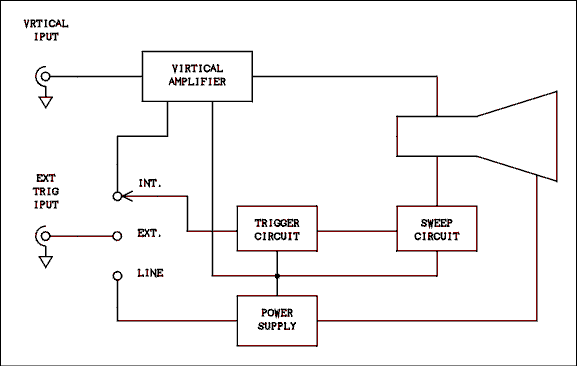
Figure 2.26 Block Diagram of an Oscilloscope.
For a verbal description click here.
Triggered Sweep.
The beam does not begin another trip across the screen immediately; it waits until some triggering event has occurred. The beam is kept dark until it is triggered. When triggered, it is turned on and begins another trip across the screen. The wave on the Y axis is, in most cases, what triggers the sweep to begin.Because the sweep begins at the same point on the wave every time it repeats, successive sweeps fall exactly on top of each other and what the user sees is a stable display.
The Power Supply.
The power supply provides high voltage to the CRT to accelerate the electrons to a high enough velocity to make the screen glow. It also supplies operating voltages to all of the circuits in the oscilloscope. There are no operator adjustments in the power supply (unless you count the ON OFF switch).Reading the Oscilloscope.
There are lines etched on the inside of the CRT screen which divide the screen into squares which are one centimeter on a side. The squares are further divided into 0.2 cm by small hash-marks. For some reason, oscilloscope manufacturers no longer call a cm a cm. They now call it a div for division.The range switch of the voltmeter section is usually called the "volts/div" switch. To read the voltage being measured by an oscilloscope it is necessary to read the height of the wave on the screen (in div) and multiply it by the setting of the range switch.
Example 2.24.
A wave on the screen of an oscilloscope has a vertical distance between its positive and negative peaks of 5.35 div. The range switch is set to 0.2 volts/div. What is the peak-to-peak voltage of the wave?Solution:
The peak-to-peak voltage usually written as the P-P voltage is the product of the peak-to-peak distance and the range switch setting. The P-P voltage is 5.35 div x 0.2 v/div = 1.07 volts.The horizontal axis of an oscilloscope is actually a time interval meter. The range switch for the time interval meter is the time/div or sec/div (seconds per division) control. To make a time interval measurement it is necessary to multiply the horizontal distance between the two points by the setting of the sec/div switch.
Example 2.25.
The width of a pulse on the screen of an oscilloscope is 7.3 div and the sec/div switch is set to 5 us/div. What is the width of the pulse in units of time?Solution:
The pulse-width is 7.3 div x 5 us/div = 36.5 us.Example 2.26.
Eight cycles of a sine wave cover 4.45 divisions on the screen of an oscilloscope and the sweep range is set to 0.5 us/div. What is the frequency of the sine wave?Solution:
The sweep range is just another name for the sec/div switch. The frequency is in hertz, which is cycles/sec.f = 8 cycles / (4.45 div x 0.5 us/div) = 3.60 MHz.
The Times Ten Probe.
The input impedance of an oscilloscope is rather low as voltmeters go. A typical value is 1 M ohms of resistance in parallel with 50 pf of capacitance. For most measurements the resistance needs to be higher and the capacitance lower than the input impedance as stated.Higher resistance and lower capacitance can be obtained by using a special probe with the scope. The input end of the probe contains a 9 M ohms resistor in parallel with a 50/9 pf capacitor. The 9 M ohms resistor in conjunction with the 1 M ohms resistance of the scope input will give a total input resistance of 10 M ohms but it will attenuate DC and low frequency input signals by a factor of ten. The capacitor in the probe must have an XC which is 9 times that of the XC of the input capacitance of the scope so that high frequencies are also attenuated by a factor of ten. The capacitor in the probe is adjustable and the probe should be "calibrated" before it is used.
Back to Fun with Transistors.
Back to Fun with Tubes.
Back to Table of Contents.
Back to top.
2.13 Problems.
- What is the period of an AC signal which has a frequency of 2175 hertz?
- An oscilloscope measurement shows a wave to have a period of 2.2 us. What is its frequency?
- What is the wavelength in meters of a radio wave whose frequency is 162.25 MHz?
- What is the frequency of a 75 meter long radio wave?
- What is the angular frequency of the 60 hertz line?
- What are (a) the peak and (b) the peak-to-peak voltages of the 120 volt AC line?
- An oscilloscope measurement shows an AC sine wave to have a peak-to-peak value of 9.5 volts. What is its RMS voltage?
- What is the reactance of a 470 uf capacitor at a frequency of 120 hertz?
- What size capacitor is required to have a reactance of 1 ohm at a frequency of 60 hertz?
- If a 100 uf capacitor is connected across a 10 volt 400 hertz AC source, how much power is dissipated by the capacitor.
- What is the reactance of a 2.5 mH coil at a frequency of 455 kHz?
- How much inductance is required to have a reactance of 1000 ohms at a frequency of 1000 hertz?
- In a series RC circuit the voltage across the resistor is 4.4 volts and the voltage across the capacitor is 3.5 volts. The resistance of the resistor is 560 ohms and the frequency is 60 hertz. (a) What is the reactance of the capacitor? (b) What is the capacitance of the capacitor? (c) What is the magnitude of the generator voltage? (d) If the phase angle of the resistor voltage is taken as zero degrees, what is the phase angle of the capacitor voltage? (e) What is the phase angle of the circuit current? (f) What is the phase angle of the generator voltage?
- A series RLC circuit is connected across a generator whose frequency is 100 kHz. The resistor is 100 ohms, the inductor is 5 mH and the capacitor is 390 pf. What are the magnitude and phase angle of the impedance?
- An RC high-pass filter uses a .01 uf capacitor and a 15 k ohms resistor. What is the attenuation ratio of this filter at frequencies of (a) 10 hertz, (b) 1 kHz and (c) 100 kHz?
- An RC low-pass filter is to use a 1 M ohms resistor. Select the capacitor for an attenuation of 50 dB at 60 hertz.
- Convert the following attenuation ratios to dB: (a) 0.707, (b) 0.316, (c) 0.178 and (d) 0.0316.
- Convert the following gain figures to dB: (a) 1, (b) 2, (c) 3.16 and (d) 17.78.
- Obtain a piece of semi-log graph paper and plot the frequency response data given below. See also problem 20 below.
Frequency, Hz dB Frequency, Hz dB Frequency, Hz dB 1.00 Hz -40.0 1,000 -0.1 1,000,000 -40.0 1.78 -35.0 1,778 -0.1 --- --- 3.16 -30.0 3,162 -0.4 --- --- 5.62 -25.0 5,623 -1.2 --- --- 10.00 -20.0 10,000 -3.0 --- --- 17.78 -15.1 17,780 -6.2 --- --- 31.62 -10.4 31,620 -10.4 --- --- 56.23 -6.2 56,230 -15.1 --- --- 100.0 -3.0 100,000 -20.0 --- --- 177.8 -1.2 177,800 -25.0 --- --- 316.2 -0.4 316,200 -30.0 --- --- 562.3 -0.1 562,300 -35.0 --- --- - As an alternative to problem 19, if you cannot find a piece of 6 cycle semi-log graph paper, try this. Take the common log of each frequency. Plot dB versus log of frequency on linear paper. BUT LABEL THE HORIZONTAL AXIS OF THE GRAPH WITH FREQUENCY NOT LOG OF FREQUENCY!
- As a more modern alternative, enter the above data into a program that will draw a graph on the computer screen or printout. Be sure to select log for the horizontal axis.
- A square wave has a peak voltage V of 25 volts. What are the peak values of: (a) the fundamental frequency; (b) the 9th harmonic; (c) the 50th harmonic; and (d) the 99th harmonic?
- A square wave has a peak-to-peak voltage of 266.6 volts and a frequency of 60 hertz. What is the RMS voltage of: (a) the fundamental frequency and (b) the frequency and RMS amplitude of the harmonic which falls immediately below 10 kHz?
- What circuit would you use to convert a 60 Hz square wave into a series of narrow pulses? Draw the circuit and give one of its proper names. It is not necessary to give component values.
- If you apply an AC plus DC voltage wave of the type VDC + VAC sin( wt ) to an integrating network which has a time constant much longer than the period of the sine wave, what will the output mainly consist of?
- A series resonate circuit is made up of a 2.5 mH inductor, a 48.9 pf capacitor and a 100 ohms resistor. What is: (a) the resonant frequency of this circuit? (b) the Q of the circuit? And (c) the 3 dB bandwidth of the circuit?
- In the circuit of question 26 the bandwidth is too narrow and must be increased to 30 kHz. This can be done by adding resistance to the circuit. If a resistor is added to increase the bandwidth to 30 kHz, (a) what is the new value of Q and (b) how much resistance must be ADDED to the circuit?
- A variable inductor which is used in the laboratory has a nominal resistance of 40 ohms at a frequency of 1 kHz. What is the Q of this inductor at this frequency for inductance settings of (a) 5 mH and (b) 50 mH?
- An all-electric home is drawing a current of 65 amperes at a voltage of 240 volts. What is the current on the primary side of the supply transformer if the voltage is 9200 volts?
- A certain transformer has a 120 volt primary and a 40 volt secondary which is rated at 2.5 amperes maximum. What is the minimum size fuse which should be used in the primary to protect this transformer from over-Load?
- A triangular wave is displayed on the screen of an oscilloscope. Points are given on the screen using Cartesian coordinates with the point (0,0) at the left side of the screen and centered top to bottom. The first positive peak of the wave is at (1.2,4.3), the first negative peak is at (3.9,-4.9), the second positive peak is at (6.6,4.3) and the second negative peak is at (9.3,-4.9). (a) If the voltage range is set to 20 mv/div, what is the P-P voltage? (b) If the sweep range is set to 50 us/div, what is the frequency of the wave?
- In question 31 if a times ten probe is being used, what are (a) the P-P voltage and (b) the frequency?
Back to Fun with Transistors.
Back to Fun with Tubes.
Back to Table of Contents.
Back to top.
2.14 Answers to Problems.
- 460 microseconds.
- 455 kHz.
- 1.14 meters.
- 4.00 MHz.
- 377 radians per second.
- (a) 169.7 v, (b) 339.4 v.
- 6.72 v.
- 2.82 ohms.
- 2,650 microfarads.
- Trick question. The answer is the big zero.
- 7.15 k ohms.
- 159 millihenrys.
- (a) 445 ohms, (b) 5.95 microfarads, (c) 5.62 volts, (d) -90 degrees, (e) 0 degrees, (f) -38.5 degrees.
- 945 / -83.9 degrees.
- (a) 9.42 x 10⁻³, (b) 0.686, (c) 1.00.
- 0.839 microfarads.
- (a) -3.01, (b) -10, (c) -15.0, (d) -30.
- (a) 0, (b) 6.02, (c) 9.99, (d) 25.0.
- Whether you use semi-log graph paper,
- Liner graph paper, or
- a computer program the graph you get should look like this.
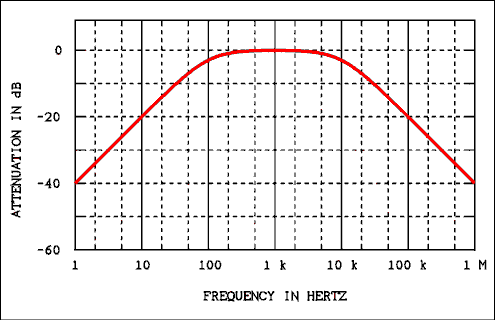
For a verbal description click here.
- (a) 31.83 v, (b) 3.537 v, (c) 0 v, (d) 0.3125 v.
- (a) 120.0 v, (b) 0.7273 v and 9,900 Hz.
- High-Pass Filter. Differentiating Network.
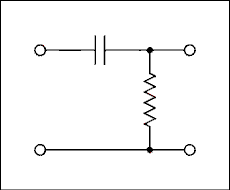
For a verbal description click here.
- All of the DC, very little AC.
- (a) 455.2 kHz. (b) 71.5. (c) 6.366 kHz.
- (a) 15.18. (b) 138.3 ohms.
- (a) 0.7854, (b) 7.854.
- 1.696 Amps.
- 0.8333 Amps.
- (a) 0.184 volts. (b) 3.704 kHz.
- (a) 1.84 volts. (b) 3.704 kHz.
Back to Fun with Transistors.
Back to Fun with Tubes.
Back to Table of Contents.
Back to top.