Phase Diagram of water
In details
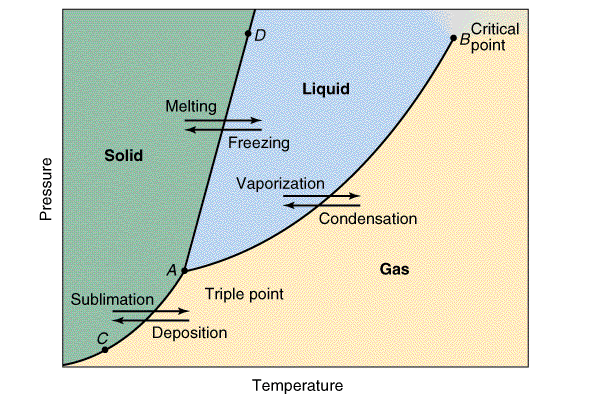
The structure of the Phase Diagram is completely Different in big details depending
on the kind of substances.
There is only one kind of place where all of the three phases of a pure
substance turn into equilibrium. This is mentioned as the triple point [POINT A
on the diagram].
The liquid or vapor equilibrium curve ends at a temperature
and pressure where as gases as well as liquids become very different and cant be told appart. This
is said to be the critical point [POINT B on the diagram] and therefore has
a high temperature and a critical pressure.
At POINT C and POINT D on the diagram, two phases are in
equilibrium and are off the line entirely,there is only one stable phase of
this substance
Comparison between diagrams. Water(a)
and Dry Ice(b)
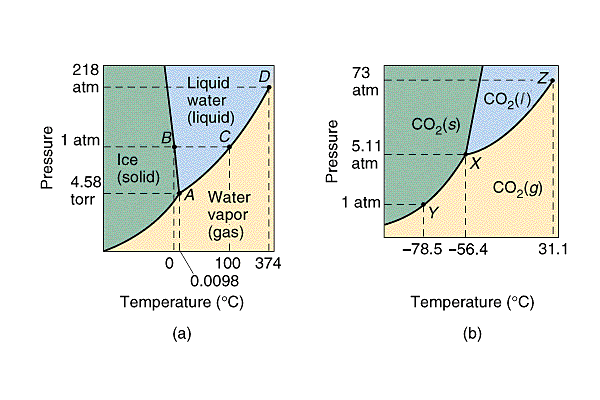
Liquids can be fleeting...
-
Liquid water exists with its vapor at 1 atm pressure
liquid CO2 only exists above the pressure of 5.11 atm.
-
In the lab (1 atm) we see that solid CO2 directly
dissociates into gaseous CO2 without making a liquid at all.
-
Liquid CO2 is found in most CO2 fire
extinguishers, but only at a temperature below 31.1 oC, (88
F), where the liquid becomes inditinguishible from the gas.
-
Liquid water persists to much higher temperatures, over 300
oC, but only at great pressure (100's of atm).
-
Only water has a liquid / solid equibrium curve that has
a negative slope, i.e. it melts when you squeeze it. Water is unique in
its highly structured liquid phase (which is why life grows in water)
HOME || Solids || Liquids||
gas
(Sub page)
Phase Transition ||
phase Diagram
This site was created by George Pai and Sherwin Darlou

