
2012 Trends in Gold Market
On 5-6 September 2011, gold price briefly touched US$1,920.
Starting in 2012, gold was traded $1,575 and enthusiasts had hoped the price would exceed the $2,000 mark in the year.
Nevertheless, it did not go higher and was traded at $1,700s in February and then between September and November
— reaching the highest price of $1,785 only.
Close to the end of 2012, some analysts still anticipated the price would break through the $2,000 barrier in the near future.
The rationalization is: With possible deprecation of currencies, the debt problems, the downgrade of government bonds, the
temporary loose monetary policies and potential inflation, gold should be a safer haven.
Unfortunately, the economies of developed countries had slid again to another slowdown in Q4 of 2012, including that of the United States.
The global market is weak for all precious metals. Gold price is thus not expected to rise rapidly in the first half of 2013.
For over a decade, gold had gained a very solid return — a five-fold increase from $250-300 to the present $1,600s.
In the recent recession, gold started from $803 in December 2007 and ended to a two-fold increase in February 2013 (Fig. 1).
Although gold is not expected to continue its previous spectacular returns soon, many financial managers now recommend keeping
a small fraction of personal portfolio in gold as an emergency reserve for financial stress.
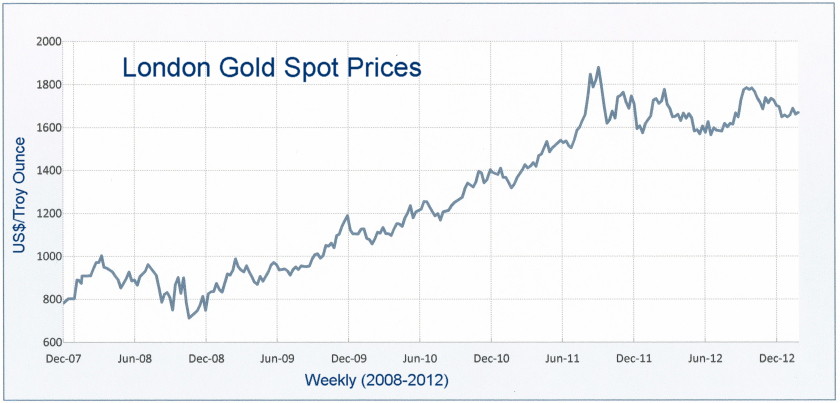
Figure 1. Weekly London Gold Spot Price between Dec 2007 and Jan 2013
Source: www.gordoncorner.com
[ Middle | Bottom ] of Page
According to a November 2012 report by World Gold Council, gold global demand was 1,084.6.6 tonnes (US$57.6 billion) in Q3.
The demand comprised 448.8 tonnes from Jewellery sector, 429.9 tonnes from Investment, 108.2 tonnes from Technology and 97.6 tonnes from Official sector.
Because of high prices and the slow economy, both jewellery and technology demands dropped in 2012 — -12% and -7% drops respectively from September 2011 to September 2012.
The investment demand was stable with only small drop of -1% due to the popularity of gold exchange-traded funds (ETFs) with a 168% rise.
The bar and coin demand was -13% off. The only sector showing a net increase was e Official sector — a 49% increase.
The global supply showed a small decline of 2% from September 2011 to September 2012 — -1% of mine production and -2% of recycled gold.
The total supply in Q3 of 2012 was 1,188.3 tonnes. This comprised 727.6 tonnes from mine supply and 460.7 tonnes from recycled gold (Table 1).
In 2012, there were fewer reports about new big exploration projects, but the reserves from present mines are likely to meet the demand for the next few years. At this moment, the operating cost of gold production ranges from US$200 to US$400 per ounce in Latin America and US$500-750 in North America. After the addition of royalties, capital costs and other expenses, the total cost per ounce could exceed US$1,000 in December 2012.
| Demand | Q4'10 | Q1'11 | Q2'11 | Q3'11 | Q4'11 | Q1'12 | Q2'12 | Q3'12 |
| Jewellery | 562.7 | 551.8 | 490.1 | 458.0 | 472.2 | 486.9 | 416.9 | 448.8 |
| Technology | 115.9 | 115.5 | 118.7 | 115.2 | 103.5 | 109.1 | 109.9 | 108.2 |
| Investment | 370.5 | 341.2 | 390.9 | 509.4 | 462.2 | 406.7 | 294.2 | 429.9 |
| Official Sector | -17.3 | 136.9 | 66.2 | 140.8 | 112.8 | 115.1 | 161.2 | 97.6 |
| Total Demand | 1,031.8 | 1,145.5 | 1,066.0 | 1,223.5 | 1,150.7 | 1,117.8 | 982.2 | 1,084.6 |
| Supply | Q4'10 | Q1'11 | Q2'11 | Q3'11 | Q4'11 | Q1'12 | Q2'12 | Q3'12 |
| Mine | 658.3 | 668.3 | 720.3 | 741.3 | 706.4 | 660.0 | 701.5 | 727.6 |
| Recyled Gold | 479.2 | 358.2 | 413.9 | 468.7 | 428.1 | 385.4 | 390.4 | 460.7 |
| Total Supply | 1,137.5 | 1,026.5 | 1,134.1 | 1,209.9 | 1,134.4 | 1,045.5 | 1,091.9 | 1,188.3 |
[ Top | Bottom ] of Page
According to statistics, India and China make up about 50% of global gold demand.
India is the largest buyer of gold but could be overtaken by China in the near future.
The Indian government has imposed changes of regulations on gold import and consumption in order to balance the deficit in its current account.
It increased custom duty twice on gold imports (to 2% & to 4%) in 2012 and again in January 2013 .
There are excise duties of 10% on bar and jewellery. A 1% tax is also added to jewellery of over 200,000 rupees about US$3,720).
Combining the taxes and the economy slowdown, Indian traders and retailers naturally curtailed gold imports in 2012.
In Q3, the import ticked up slightly as traders took advantage lower gold price to replenish their inventory.
By 2013, the rupee was in a better shape though the increase in the Indian market was not strong enough to compensate the drop in the Chinese market.
The gold market in China is now weak.
China suffered a slowdown in the economy and the consumption of 18K jewellery by its new middle class declined in 2012.
However, the decline of 24K jewellery and gold bar were not too pronounced.
As China is the largest gold producer, the Chinese government is still encouraging gold consumption of its domestic market (Table 2).
With rising income, Chinese citizens are expected to buy more gold when the pace of economy growth picks up in the second half of 2013.
| Countries | 2010 | 2011 | Reserves |
| China | 345 | 361* | 1,900 |
| Australia | 261 | 270 | 7,400 |
| The United States | 231 | 237 | 3,000 |
| Russia | 192 | 200 | 5,000 |
| South Africa | 189 | 190 | 6,000 |
| Peru | 164 | 150 | 2,000 |
| Canada | 91 | 110 | 920 |
| Ghana | 82 | 100 | 1,400 |
| Indonesia | 126 | 100 | 3,000 |
| Uzbekistan | 90 | 90 | 1,700 |
| Mexico | 73 | 85 | 1,400 |
| World Total | 2,560 | 2,700 | 51,000 |
Source: Wikipedia.com/USGS — Jan 2012
[ Top | Middle ]
The central banks were the pillars of the gold market in 2012.
Almost all banks bought some gold from the global market and increased their gold reserves.
Germany has been keeping a large reserve in the vault and has used only a very fraction to make commemorative coins.
Canada, who decided not to keep gold reserve and sold them during previous recessions, had imported gold recently.
Back in 2010 the Canadian Royal Mint introduced a Canadian Gold Reserve program/Exchange-Traded Receipt fund.
In this program, the mint bought gold and hold the gold in the vault for investors.
Yet, Canada still maintains only 3.4 tonnes in the reserve;
it had a peak of over 1,000 tonnes in 1965 and dropped to around 500 tonnes in 1989.
With the uncertainties of global financial system, the buying trend in the Official sector should be continuing to the foreseeable future.
The following table shows the data of official gold holders in the world.
| Largest Gold Holders | 2007 | 2009 | 2010 | 2011 | Foreign Reserves% |
| The United States | 8,133.5 | 8,133.5 | 8,133.5 | 8,133.5 | 76.3% |
| Germany | 3,417 | 3,413 | 3,407.7 | 3,391.3 | 73.5% |
| IMF | - | 3,217 | 2,807.0 | 2,814.0 | n/a |
| Italy | 2,453 | 2,451.8 | 2,451.8 | 2,451.8 | 72.8% |
| France | 2,622 | 2,487 | 2,435.4 | 2,435.4 | 71.2% |
| China | 600 | 1,054.1 | 1,054.1 | 1,054.1 | 1.7% |
| Switzerland | 1,166 | 1,040.1 | 1,040.1 | 1,040.1 | 11.0% |
| Russia | - | 726.0 | 934.9 | 937.8 | 9.8% |
| Japan | 765 | 765.2 | 765.2 | 765.2 | 3.3% |
| Netherland | 624 | 612.5 | 612.5 | 612.5 | 60.6% |
| ECB | 604 | 537 | 502.1 | - | n/a |
| India | - | 358 | 557.7 | 557.7 | 10.3% |
As the global economy is still weak and slow, gold may not be able to bring a high gain of return in the short run.
Some analysts now see gold a medium-to-long term investment to hedge against inflation —
a possible span from two years when the interest rate rises again to three-five years away from now when the business cycle comes to the peak.
Overall, an investor could use gold as an emergency asset in various situations — bankruptcies, financial stresses, national unrests, wars, etc.
Note of Interest
Gold's poorer cousin, silver, has performing not too badly with a double increase of value since 2008.
Silver spot market was about $16 in January 2008, reached a sharp peak of $48.5 in April 2011, and then declined to US$26.3 in July 2012.
On 11 February 2013, the price was about US$30.8. As a precious metal and an industrial commodity, silver is very volatile;
at this moment it is also weak.
Unit conversion: 1 metric tonne = 1,000 kg; 1 kg = 32.150737 troy ounces; 1 tonne = 32,151 ounces
* This article is written for personal references only. No advice, nor qualified idea & nor opinion are given; also no accuracy of figures are guaranteed