
Figure 7.1 Simple simulated power supply.
Table of Contents.
Lesson 1: Fundamental Drawing Skills and a Simple Simulation.
Lesson 2: Introduction to Frequency and transient Analysis.
Lesson 3: Configuring LT Spice and more Drawing controls.
Lesson 4: Locating, modifying, and installing vacuum tube models.
Lesson 5: Operating point of vacuum tube circuits. Introduction to stepping and plate curves.
Lesson 6: Finding, installing, and using, potentiometer symbols and models.
Lesson 7: Transient analysis of unregulated power supplies. This page.
Lesson 8: Transient analysis of power supply regulators.
Lesson 9: Transient and frequency analysis of amplifiers with feedback.
Lesson 10: Lossless transformers.
Lesson 11: Making symbols and models.
Lesson 7
Transient analysis of unregulated power supplies.What you will learn in Lesson Seven. How to:
- Start with a simple demo power supply circuit.
- Set up a switch and load for transient analysis.
- Set up the "oscilloscope" to view the test.
- Test some "real" power supplies.
Having trouble remembering all those syntaxes?
Control click on this link to open it in a new window. Control Tab will switch back and forth between the current lesson page and this help page.
Here's a summary page that should help.What are we trying to accomplish?
Good question. It's not always enough to put a power supply under load and measure the DC and AC ripple voltage. Most power supplies are powering circuits that draw varying amounts of current. Sometimes the current changes gradually but more times than not the current can change in sudden steps or spikes. A class B audio amplifier for example will have to supply currents that change over a 10 to 1 ratio and the changes can happen quite suddenly. We are interested in knowing how much the DC voltage is reduced and how long it takes it to recover. Also what does the ripple do during the transient load and the recovery period. Also for a very short load spike how does its timing relative to the phase of the power line effect the reduction and recovery.We will do regulator circuits in the next lesson but in this one we are interested in those many applications where a simple unregulated power supply is a part of the design.
Developing the tool.
The use of the word tool in the above heading refers to a circuit which we can use to turn a load on and off. This will be the first of our load tools. LTspice provides us with a voltage controlled switch. This can be configured to be a perfect relay. It draws zero current, has zero closed contact resistance, infinite open contact resistance, and closes and opens in zero time. Because LTspice does not like zero value resistance the contact resistance can be as small as we want it, it just can't be zero. 1 μΩ, 1 nΩ, how about 1 pΩ. The next one down is 10-15 but I don't remember what it is.The other part of the load tool will be an ordinary resistor. In spice a resistor obeys ohm's law. That's all it does. It does not obey any of the laws of thermodynamics. In other words it can dissipate a kilowatt, a megawatt, or a terawatt. It is possible when setting resistor parameters to specify a power rating but if this is left blank there is no power limit.
How can we test our tool?
Obviously we need a power supply. But a unique power supply. We need to know its exact characteristics. So Let's go to the LTspice drawing board and see what we can put together. Let's let Mr. Thevenin be our guide.
Figure 7.1 Simple simulated power supply.
Duplicate this figure in your own version of LTspice and save it as spl-fig-07-1. Be sure that the spacing between the two output leads is the length of the capacitor plus two steps, one on each end.
Above you see a standard Thevenin circuit with an extra part not usually seen in the company of a DC voltage source. The capacitor will cause our circuit to perform similarly to a very well filtered power supply.
We will get to AC generators and rectifiers in time. Note in passing that the two output connections are spaced the length of a capacitor plus 2 spaces.
Now for the tool.
Here is what I have come up with. It took me some time to figure out how to provide the switch symbol with a model.

Figure 7.2 Test load for any power supply.
First things first. Duplicate this drawing, as you did above. Save it as "spl-fig-07-2. The disconnected capacitor on the left edge of figure 7.2 is a distance measuring tool. It is there to help you get the spacing right between the two connecting wires so they will match up with the power supply. After you have completed the drawing don't forget to delete the capacitor.
In complete innocence I placed the switch symbol on the drawing board and preceded to connect the circuit of Figure 7.3 below. When I ran it I got an error message saying that a model for the switch could not be found and did I want to use the default model. There was no button labeled "why of course you idiot" so I clicked the one with "Yes". A box popped up that said spice error log but behind it was the graph panel so I closed the error box. Everything seemed to be working normally until I ran the simulation again. I assumed that LTspice would remember ever after that I wanted to use the default model. I'm sorry to say the program does not have that much built in intelligents. I'm not sure it has any. So why do all the other symbols in the list have models but this one does not? I still haven't learned the answer to that one. I worked around this for a while and then decided to do something about it. Looking for the answers to more practical questions I dug into Brocard's book. The answer was right there on page 469 in figure 16.2 but I failed to see it at first. After some more fruitless digging I went to the internet and on the Linear Technologies site I found the answer. When I looked back into the book I realized what I had missed. The answer was there too. This was a new one on me.
OK, now for the model. Look at the lower left corner of the diagram. What is that? The word model isn't it. I'm learning this right along with you guys. Notice next to the symbol where the value would normally be are the letters VCS. The use of these letters was my decision to make. For me they stand for Voltage Controlled Switch. These letters also appear in the ".model" directive. Ron and Roff are exactly what you would assume. Spice doesn't like zero resistances so I used something close to it. Vt is the transition voltage, where the switch changes states. Vh is the hysteresis voltage. Lser (series) and Vser are also what you would expect. Notice that I have set everything after Roff to zero. I have learned that in LTspice omitting a value does not guarantee that it will be set to zero.
Connecting the load to the power supply.
You've done this before. Load both figures "spl-fig-07-1" and "spl-fig-07-2" into LTspice. Use control tab to switch between them. Switch to figure 7.2 and press control C. Press and hold the left mouse button and draw a box around everything in the figure including all text. Release the button and switch to figure 7.1. You now have figure 7.2 overlaid on figure 7.1. Move the figure around until the ends of the wires on the left of the load just touch the wires coming out of the right of the power supply. If the part of the diagram that is movable by the mouse seems to bump up against a limit, and won't move any farther to the right, back off a little and bump it again. Each time you do this the limit will move letting you move the diagram a little farther to the right. Keep doing this until you can connect the leads. Remember, the ends of the wires must just touch. If they are overlapping they won't connect.Click the left mouse button. Before you do anything else save this figure as "spl-fig-07-3". (Note: spl stands for spice lessons.) Press the space bar to make the diagram the right size to fill the screen without any part of it being cut off. You should now see this.

Figure 7.3 Test power supply with load.
All of the spice directives you need are on the diagram. Run the simulation. The graph is blank because you haven't told spice what you want to display. Click on the banner above the schematic and then hover over the wire connecting to the "output symbol. Touch the probe to the line and click. Now you will see this.

Figure 7.3-1 Transient response of Test power supply with load.
Click on the banner above the graph and press control S. This will save the connection so you won't have to do it again. Notice that the voltage has settled in at the open circuit value of 32 volts. After the switch closes and the capacitor discharges a bit the voltage settles down to the expected 30 volts.
The tran directive is telling spice to run the simulation but don't start collecting data until 190 ms have passed. So zero on the time axis is 190 ms after the primary switch was closed. You can see that the voltage is at 32 volts but when the load is connected at 10 ms the voltage begins to drop exponentially. The time constant is RC but what R. If you trace around the circuit from one end of the capacitor to the other you can follow a path through R1, V1, ground, and back to the other end of the cap. If you take an alternate path you can trace through R2, S1, (which is closed), and back to the other end of the cap again. These are parallel paths so as far as the capacitor is concerned R1 and R2 are in parallel. Use the cursor to find the 1 - 1/e point on the graph. Confirm the calculation that time constant is RC where R is the parallel combination of R1 and R2. My reason for defining the values of these resistors by ".param" statements is that at some time in the future I may want to step the values to illustrate something not foreseen at this moment.
If you want to see what's going on for the first 190 ms change the tran directive to read. ".tran 0 400ms 0ms 1ms startup". The last item in the tran directive means that the first checkbox is checked and V1 will be turned off at T=0 and be turned on at T=0+. You must do this part for yourself to see what is happening. At what time does the trace cross the 1/e point. What is the value of R in τ = RC?
Now for a more realistic power supply.
Alright, so I have to go to Radio Shack and buy a Realistic power supply. No. They have closed almost all of their stores and I don't think they have the Realistic brand anymore.Now you are going to draw a power supply to test with our load tool.
You should begin with the "no open file" screen of LTspice. Open the file spl-fig-07-1.
Before doing anything else select Save as from the files menu and save the drawing under the name spl-fig-07-4.
You are going to draw the circuit shown in Figure 7.4.
Now move the DC generator V1 to the left and up, to the approximate position where you see V1 in figure 7.4.
Also delete the wires going to R1. Then move the ground symbol and its connecting wire to the left and up a little.
Place another voltage generator on the drawing board below V1 so its positive terminal is two steps below the negative terminal of V1.
Right click on V1 and erase the value from the DC voltage box.
Then click the "advanced" button.
In the upper right corner erase the DC value.
In the upper left corner select the sine radio button.
Fill in the text boxes in the popup.
Leaving the last 4 blank instead of typing zeros will shorten the label on the generator.
Do almost the same for V2. You won't have to erase the DC value.
Press F7 or F8 and click on one of the generator labels. You can now move it with the mouse. Press ctrl-R to rotate it and position it to the left of the generator. Do the same for the other generator label.
Now delete the directive "param Vth=32v".
Move the other two param directives to the right until their left ends line up with the left end of R1.
Edit the "Rth" one for a value of 0.1 ohms.
If you like, edit the "Cf" directive to state the value in mF rather than μF.
Place two diodes on the drawing in the approximate positions shown.
Right click on one of the diodes and click on "Pick a new diode".
In the dialog that pops up find the MURS320. It isn't very far down the list. The list is not in alpha numeric order but a sharp eyed person like you should be able to spot the number in the left hand column.
Do the same for the other diode.
Now wire everything together as in figure 7.4.
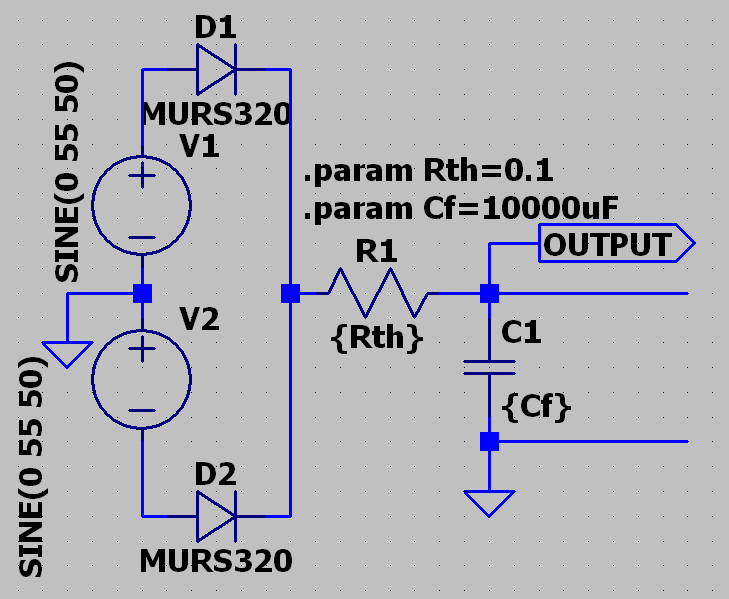
Figure 7.4 The realistic power supply.

Figure 7.4.1 Filling in the text boxes for the sine wave generator.
I used a line frequency of 50 Hz because the period will be easier to read on a graph scale. I'm sure our European friends will be grateful. My apologies to north America.
What's next? You've done it before.
Without closing figure 7.4, open figure 7.2. Copy all of figure 7.2 onto figure 7.4. Line up the connecting wires and click.
Before doing anything else, BE SURE to save the composite figure as "spl-fig-07-5".
Remember to close 7.2 after you complete this procedure.

Figure 7.5 Power supply and load.
Ever wondered why the lights flicker when one of those transistor amplifiers is powered on? Here's a good clue why. The ten thousand microfarad capacitor is charged to 51 volts in what looks like the first 5 milliseconds after the primary switch is thrown. That's about 26jouls. A joule is the same as a watt second. Dividing by time will give the power. 26 / 5 ms = 5.2 kW. It only lasts for 5 ms but that's an incredible load to pull through number 14 wire.
Does the timing of switching on the load have any significant effect on the response?
Well, let's see if we can figure that one out. We did say up front that we would look into that question. Now that we've seen the turn on transient let's start taking data after that event and get a good look at what's going on.

Figure 7.5.1 Graph showing what happens before and after a 1.73 amp load is switched on.

Figure 7.5.2 Graph cursors show the center of discharge at multiples of 10 ms.

Figure 7.5.3 Graph cursors show center of charge time at odd multiples of 5 ms.
The graphs in figures 7.5.1, 7.5.2, and 7.5.3, all look the same. That's because they are. The only difference is, in .2 and .3 the cursor is being used to find the precise center time of the capacitor discharge and charge respectively. The charging part of the cycle is centered on odd multiples of 5 ms while the discharge part of the cycle is centered on multiples of 10 ms. The graphs clearly show that when the load was turned on the capacitor was in the discharge part of its cycle although discharging didn't begin until the load was connected. So let's change the turn on time a bit to see how things change.
But what do we change. The load turn on time is set by V3 that drives the switch. We can get help with what each of those numbers in the label of V3 by right clicking on the symbol.

Figure 7.5.4 Syntax of pulse generator label.
In spite of the polarity markings on the switch control input, when the generator pulse turns on the switch turns on (closes). Ton means T on (time of voltage turn on). The generator turns on at 200 ms, but the graph shows the load turning on at 160 ms. Right click on the ".tran" directive.

Figure 7.5.5 Syntax of .tran directive.
Look at the "Time to start saving data". It is set to 40 ms. That means, on the graph scale we must add 40 ms to obtain the time since the simulation started. 160 ms + 40 ms = 200 ms which is what it should be. So if we want to move the load turn on time up to 165 ms we must change the parameters of V3 so it will turn on at 205 ms. Here's what we get when the simulation is run.

Figure 7.5.6 Load is switched on 5ms, 1/4 cycle, later than before.
Hmmm. It's definitely different but is it better or worse? The problem we are having here is, in the instant that the switch closes the capacitor is neither charging nor discharging. What we have simulated is a turn on time delay that allows the power supply storage capacitor to become fully charged before the circuitry of the amplifier is connected by the closing of a relay. If we want to simulate an amplifier in operation with music playing at a moderate volume and suddenly something loud happens, we need to set it up that way.
A different simulation.
Add a 90 ohm resistor to the circuit as shown in figure 7.6.1. Save the altered circuit as "spl-fig-07-6". Change the ".param RL=30" to ".param RL=45". Also change the V3 turn on time back to 200 ms. Press ctrl S to save these last changes. Now run it. My graph came up blank so you will likely have to reconnect the "scope" to the output terminal.
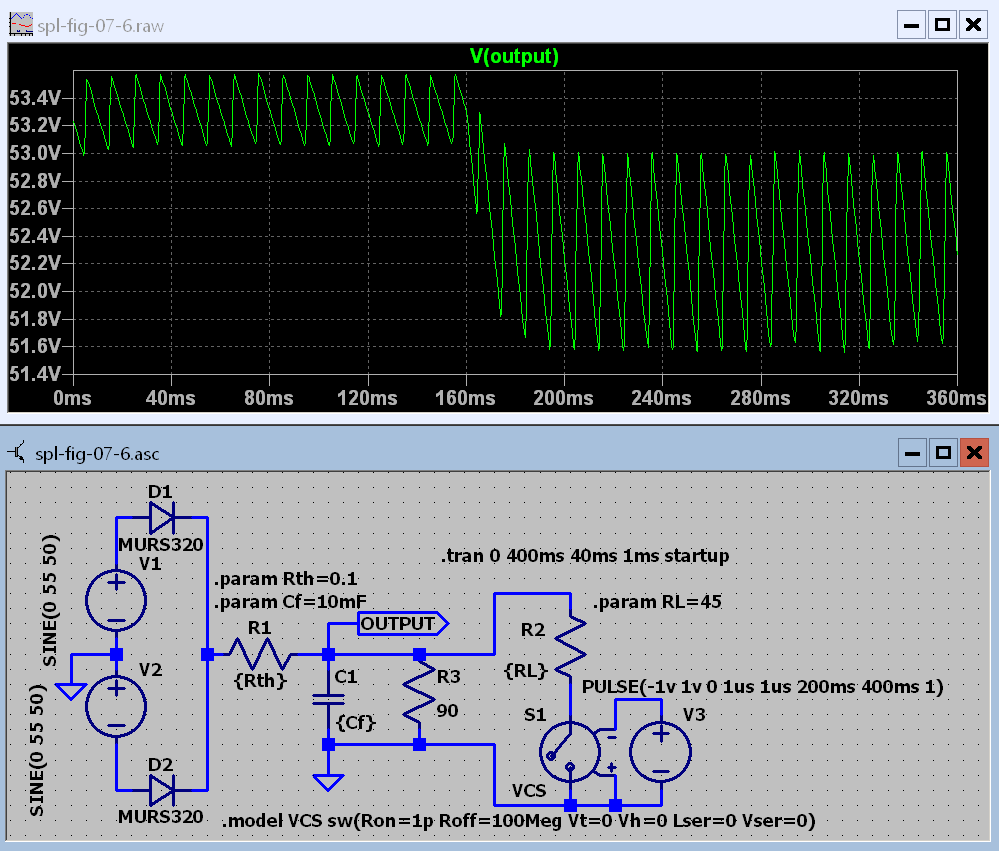
Figure 7.6.1 P S starts with a 90 ohm load that changes to 30 ohms after a total of 200 ms.
Well that's better. We now see that the switch did in deed close when the capacitor was being discharged. We can see that the discharge rate of the capacitor changed when the additional load was connected. Now let's see if we can make it happen on the charge part of the capacitor voltage. Change the V3 turn on time to 205 ms and run it again.

Figure 7.6.2 Load change has been moved to 205 ms.
I have changed the step from 1ms to 100 μs and zoomed in on the critical part of the graph. If you didn't know what was going on you would conclude that something did happen at about 165 ms on the scale.

Figure 7.6.3 At 200 ms the high current load is turned on and 20 ms later it is turned off.
The transient directive remains unchanged. To make this happen required a little gymnastics with the voltage source V3.
PULSE(1v -1v 200ms 1us 1us 20ms 40ms 1)
Conclusion.
There you have it. To do anymore would be redundant and monotonous. You now have the techniques you need to symulate any power supply from a 5 volt supply for a small digital circuit to a 3000 volt 1 amp supply for a linear amplifier. Your on your own. Have fun.
This page last updated Friday, May 06, 2022. Home.