|
11/13 -
All Star
Series Results
11/12 -
All Star
Rosters
11/06 -
Sim 5 Review
11/03 -
Different
Approaches to Run Scoring
10/22 -
Looking at
the New Player Seasons (Batting Edition)
10/17 -
Week 2 -
Making Statements
10/10 -
Week 1
is Done
10/05 -
Opening
Weekend
09/11 -
Greatest
Pitching Staff of All time
09/10 -
T-minus 7
Days
09/05 -
The Best
Offense
09/04 -
Player Profile:
Lefty Grove
08/31 -
Player Profile: Tris Speaker
08/30 -
Remember the Era!
08/30 -
Why the 1800s
Players Were Introduced to ATB
08/27 -
The DMB Manager Profile
08/24 -
Defense Matters
08/23 -
Greatest Seasons
of All Time Baseball
08/21 -
PC Mock Draft
11/13 - All Star
Series Results
It's fun to be wrong. I joked
with several Federal League owners this pre-season about how much better
the FL is over the Union League. After all, the vast majority of
previous ATB champions all happen be in the FL. To add weight, the
FL jumped out to a huge lead in head to match-ups in the first month.
Then came the All Star game. Again, I thought for sure the FL would
easily dispatch their foe's but when looking at the teams, it became
clear the All Star's were evenly matched.
Then came the All Star Series itself.
On a whim, I decided to up the number of games to 11 without actually
thinking it would go this long. Sure enough, the Fed's jumped out
to a 5-1 series lead and I stopped paying attention (well, as much as
one can stop when he's running the sims on his own computer).
But then in Game 7 the Fed's ran into
a wall in the form of the Union League's bullpen. In Game 8
Jason Schmidt proved his was an All-Star; Game 9 Randy Johnson
tosses a 3-hitter. Then came Game 10 and I started to worry, but
knew Pedro Martinez was on the mound. 5 runs in less than 5
innings and the series was tied at 5 games a piece. And wouldn't
you know it, the series was decided on a 2 run 9th inning rally.
Here's a game by game blow of a series that was unexpectedly
stimulating.
Game 1: UL 1, FL 2 - FL Leads
Series 1-0
In a great pitchers duel between
Number One starters Randy Johnson (DBS) and Bill Bernhard
(MRE) the game entered the 7th inning with the visiting UL clinging to a
1-0 lead. Earlier, Lou Gehrig (STE) popped a solo home run
down the right field line to open the scoring of the series. Both
starters were cruising with Johnson striking out 6 through 6. In
the bottom of the 7th though, he made his only mistake of the game.
With 2-outs, the UL pinch hitter Tip O'Neil (MRE) walked,
bringing the 9th place hitter Nap Lajoie (CD) to the plate. The
second basemen was hitless in his two previous at bats but took a first
pitch offering from Johnson deep to right field, clearing the fence for
a 2-run home run and a one run lead.
Bernhard ran into a bit of trouble in
the 8th, but got out of a small jam by retiring Hugh Duffy (SCS)
and Charlie Keller (CWS) with runners on 1st and second.
Bruce Sutter (B&B) had a 1-2-3 ninth, striking out Mickey Mantle
(NYB) to end the game.
Game 2: FL 5, UL 6 - Series tied 1-1
The FL team picked things up right
where left off, jumping out to an early 3-0 lead when Babe Ruth
(B&B) drilled a 3-run home run off starter Curt Schilling (DBS)
with 2-outs in the first. Schilling would struggle the rest of the
night (5 IP, 7 H, 1 BB) but yielded only 1 more run, unearned, in the
6th when Honus Wagner (SCS) booted an easy ground ball with the
bases loaded.
Meanwhile, perennial ATB great
Pedro Martinez (CD) was struggling as well, giving up a run in the
third, two in the 4th, and one more in the 6th before leaving with the
game tied at 4-4. Ruth struck again in the top of the 7th, this
time with a run scoring single off of reliever Joe Sambito (CWS)
giving the Fed's a one run lead to turn over to their stellar bullpen.
Jim Poole (MRE) worked his way out of a 7th inning pickle when
Mantle was thrown out at home trying to score on a ground ball to
second. Poole then pitched a hitless 8th before giving way
to Sutter for the save opportunity.
The closer struck out Duffy but gave
up single to Wagner, bringing Mantle back up to the plate. Mantle
had driven in a run earlier and took a full count fastball over the wall
in right for a walk-off home run, tying the series at 1-1.
Game 3: UL 4, FL 8 - FL Leads series 2-1
A blowout, with the UL starter
Teddy Higuera (CWS) getting bounced after recording just three outs.
In the second inning, 5 consecutive base runners reached base with 4
runners scoring. One out later Frank Robinson (SID) smacked
a home run down the left field line scoring the 7th run of the inning.
Cy Blanton (MRE) didn't pitch particularly well for the Union
League (4 IP, 4 R, 8 H) but the pen held down the opposition easily (5
IP, 4 H, 0 R)
Game 4: FL 4, UL 2 - FL Leads Series 3-1
UL Starter Jason Schmidt (DBS)
gives up 3 runs in the 1st two innings (3 IP, 8 H, 3 R) after Robinson
strikes with a 2-run single and Darren Daulton (CD) hits a solo
home run in the second. Ben Sheets (B&B) pitched well to
record the victory (6 IP, 5 H, 5 K, 2 R) and simply tired to open the
7th, giving up back to back solo home runs to Gehrig and Mantle.
The UL pen was stellar once again, with Poole and Sutter giving up just
2 hits and no runs in the final three frames.
Game 5: FL 5, UL 3 - FL Leads Series 4-1
Going back to the #1 starters,
Johnson and Bernhard, the Federal Leaguer comes up victorious again
pitching into the 8th inning giving up 3 runs on 8 hits. Johnson
faired much worse and couldn't get out of the 4th (9 hits, 3 R).
The Fed's scored lone runs in 1st, 3rd, 4th, 7th, and 8th innings to
take a 5-1 lead before the UL threatened, making a game of it when
Rogers Hornsby (SS) and Gehrig each drove in a runner. But the
9th was quiet and the game never really in doubt.
Game 6: UL 0, FL 4 - FL Leads Series 5-1
Martinez was masterful, striking out
10 and giving up just 3 hits, en route to a complete game shutout.
Schilling was a bit unlucky, but struggled at times nonetheless (4 IP, 7
H, 4 R, 2 ER) giving him his second below average start of the series.
O'Neil, Barry Bonds (P10), Derek Jeter (AV), and Daulton
each drove in runners. The series was all but over.
Game 7: UL 7, FL 6: FL Leads Series 5-2
The UL keeps the series alive thanks
to multi-hit games from Ty Cobb (RSI), Hornsby, Gehrig, Sherry
Magee (CWS), and Steve Evans (SCS). Neither starter
pitched well, but the UL pen outperformed their opponents with Tim
Burke (SCS) nailing down a 6-out save and the chance to play again.
Game 8: FL 1, UL 2: FL Leads Series 5-3
The Union'ers won't go way as Schmidt
bent but didn't break leading his team to a 1 run victory. Schmidt
pitched into the 8th, giving up 9 hits and 3 walks, but just 1 run
before yielding to Rafael Soriano (SS) and Burke to hold down the
win. The game was still in doubt in the 9th when O'Neil roped a
2-out single to keep a mini-rally alive, but John McGraw (MRE)
was gunned down by Cobb when he tried for 3rd.
The UL offense struck in the eighth
inning, scoring their runs off of starter Sheets (7 IP, 5 H, 2 ER).
Their were signs of trouble in the 7th when Sheets narrowly got out of a
bases loaded jam, and in the eighth he couldn't hold the UL squad back
any longer. Catcher Wally Schang (STE) led off with a walk
and scored when the next batter, Hugh Duffy (SCS) doubled him
home. Octavio Dotel (AM) came in in relief and struck out
the side, but not before Mantle singled home Duffy with the game winner.
Game 9: UL 3, FL 0: FL Leads Series 5-4
Nerves? The FL bats died behind
a masterful performance from #1 starter Johnson. His line: 9
IP, 3 H, 6 K and a complete game shutout. The most he was in trouble all
night was early the 1st when Cy Seymour (SID) doubled Robinson to
3rd but Johnson induced to weak groundouts to end the inning.
The game was close throughout, with
the 1st run coming across the plate in 6th on a 1-out HR from Hornsby.
The teams entered the 9th with the UL clinging to a 1-0 lead but
Adrian Beltre (DBS) hit a 2-run home run off of reliever Poole to
put the game out of reach. The game ended on a ground ball double
play off the bat of Jeter. The UL was now just 1 game away from
knotting the series at 5 all.
Game 10: FL 5, UL 10: Series tied 5-5
The FL fans breathed a huge sigh of
relief as their squad scored 3 runs in the top of the first off of
starter Schilling when Bonds drilled a 3-run home run deep to right
center. Schilling pitched poorly for the third time in the series,
lasting just 2 innings this time. The Federal League would add
another run in third on a Nap Lajoie Home Run, staking the visitors to a
4 run lead. Nothing would go right for them the rest of the night.
Martinez made his third start for FL
and was mediocre early. He struck out the side in the 2nd but gave
up two hits. In the third he seemed unnerved when 1st Basemen
Jason Giambi (AV) booted a ground ball and gave up his first run of
the game when Duffy doubled, moving the runner to third, and Wagner
followed with a run scoring force out.
Things got worse in the 4th. A
single and a 1-out walk brought Beltre to the plate, who doubled home
both runners to bring the UL within 1 run. The next inning Wagner
singled to lead off, and while Martinez retired the next two batters, he
then grooved a fastball to Willie McCovey who drove the 1-0 offering
deep into the night and gave the UL their first lead of the game.
That was all for Martinez who left with a line of: 4.2 IP, 7 H, 5
R, 4 ER, 1 BB, 6 K.
The Union League scored again in the
6th but broke open the game for good in the 8th. Dotel started the
inning by giving up back to back singles to Jackie Robinson (CWS)
and Beltre and the 7th UL runner of the game scored on a force out by
pinch hitter Evans. The game was still in reach for the FL team,
with the score 7-5 but Duffy and Wagner then each singled home a run and
another force out made the game 10-5. The Federal League recorded
just one hit, a single, from the 6th inning on.
Game 11:
The two evenly matched teams now
found themselves in a 1 game duel, a do or die situation with 3rd
starters Higuera and Blanton facing off. Neither starter was
effective in their earlier to match-ups, giving up a combined 18 runs in
14 innings.
Both teams went down in order in the
first but the Federal League was the first to strike. In the second,
Frank Robinson homered with Bonds on base after getting hit by a pitch
giving FL an early lead. Higuera would settle down retiring 8 of
the next 10 batters he faced.
Meanwhile, Blanton was solid through
three innings, yielding just a single and walk while striking out two.
But in the 4th Hornsby led off with a single, Gehrig followed with a run
scoring double to right center, and after a sac bunt, Charlie Keller (CWS)
drove home Gehrig on a sac fly. The score was knotted at 2.
Both teams scored in the 5th.
Beltre homered for the UL and Bill Dickey (MRE) scored on a sac
fly after tripling to lead off the inning. In the 6th Gehrig
homered and put the UL on top 4-3. Higuera pitched great, lasting
through 7 giving up just 2 hits all night. Soriano relieved him
and retired the side in order in the 8th. Similarly, the UL pen
was solid - Warren Hacker (SID), Pool, and Dizzy Dean (CD)
pitched the 6th - 9th innings giving up just 2 hits and no runs.
The game would likely have been over
had the closer Burke not thrown 55 innings the night before. He
stayed in the game for 13 batters and was spent. As a result
Soriano was forced into a 6-out save situation, but never recorded an
out in the 9th. Ted Williams (MRE) started things off with
a single, battling Soriano for 7 pitches before lacing a liner to
center. Bonds came up and hit a ground ball in the 2nd base hole
just hard enough to get past Gehrig and Hornsby. Amazingly, Bonds
then took second on defensive indifference, a terrible call by the AI to
put the winning run in scoring position with nobody out. Sure
enough the next batter, Robinson again, hit a ground ball single over
second base, driving in both Williams and Bonds and winning the game.
-
MVP: Frank Robinson.
The Dumper didn't have a great line (.275 / .318 / .425) but came up
big in several games, driving in 10 runners.
-
Runner Up: Bill
Bernhard. Was great in 3 games, going 1-2 with a 1.93 ERA in
over 23 IP.
Here are some reports:
Fed League
Batting
Fed League
Pitching
Union
League Batting
Union
League Pitching
Team
Batting Totals
Team
Pitching Totals
And if you didn't notice, the box
scores are linked above each game summary.
11/12 - All Star
Rosters
The ATB All-Star "Game" is to be held
in the middle of the upcoming sim. The "game" is actually a best
of eleven series and the winning team gets World Series home field
advantage for it's league. The named starters will start in all
odd number games, with the back-ups starting in even numbered games.
Manager profiles will be identical, with pinch hitting and relief
pitching usage cranked up to at least give the appearance of an All Star
contest. Parks will be the two oldest active not already picked by
an owner - 1916 Wrigley Field and 1923 Yankee Stadium.
In case you are worried, the All Star
Series is treated as an exhibition with injuries turned off and has no
impact to the real league whatsoever, not even fatigue or pitch counts.
Here are the rosters and a brief
synopsis of which league has the edge. There are no requirements
for at least 1 representative for every team, but it did happen to work
out that this year no team is left un-represented.
OFFENSE

The Federal League enjoys a slight
advantage on offense, from top to bottom they have a few better hitters
than the squad from the Union League. As you will see, the
difference is almost entirely due the fact that the Union has no answer
to Ted Williams; the Fed's have two 1.000+ OPS starters while the
Union has just one:

The Federal's start with four batters
who get on base at a 40% clip and every member from 2nd to 5th in the
lineup slugs at least .500. Indeed, the entire team averages a
.500 slugging percentage. The Union squad has the best lead-off
hitter in the game, Ty Cobb, followed by the best hitting catcher in the
game, King Kelly.
The two teams are truly evenly
matched. The green highlight denotes a better hitting position in
the lineup, while yellow denotes the two competitors are about equal.
Defensively, the Federal League holds
the advantage with 6 players rated at Vg or better for their range.
The Unioners have 4.
STARTING PITCHING

The starting pitchers of Union League
best their opponents in every single major pitching category.
This is born out by the starting pitcher to starting pitcher comparisons
as well:
Whatever edge the Federal League had
is squarely given away by the superiority of the Union League starting
rotation. Each member of the UL is better than their counterpart.
True, a lot of this is because the Black Sox play in the Bee-Hive, the
best pitching park in the game, but their starters are not to be
underrated. This is a significant advantage for the UL.
BENCH and BULLPEN
The Top 3 pitchers for the FL are
better than the top 3 from the UL. Each sport ERA's under 1.60 and
have combined for an 8-1 record. The middle reliever corps are
about equal, and shouldn't play too much of a factor.
Hitting versus defense. Led by
Tip O'Neill, a 1.000+ OPS outfielder who can't crack the starting lineup
thanks to Ted Williams and Barry Bonds, the FL's bench is full of good
hitters. The UL are clearly weaker, but perhaps make up form it
with 2 Ex and 2 Vg defenders for situations close and late.
CONCLUSION
It's a 7 game series that anybody can
win, but the edge has to go to the UL because they better the FL in
single most important player of each game - the starting pitcher.
I'll post the results tomorrow.
In the meantime, here is the representation by team:
11/06 - Sim 5 Review
And …… we’re back on track.
There are two 40-win teams in ATB and
they both happen to reside in the Federal
League. The
New York Blues and
Rockaway Sleep Deprived Insomniacs had great Sim’s (combined 20-9)
and are now tied for first place, a full 5 games ahead of the third
place
Dyersville Black Sox. Neither team lost a series and if you take a
look at the
standings charts you can see how the two clubs are fast pulling away
from the pack. Of course, it is still early, and last time a race was
pronounced in jeopardy the following week there was a three way tie for
1st.
The Insomniacs had a strong week from
the heart of their lineup – Dan Brouthers, Arky Vaughan, and Reggie
Jackson
combined for 42 RBI in 15 games and King Kelly batted .405 in his 42
at-bats. Guy Hecker was the star for the
rotation, going undefeated in 3 starts, walking three and striking
out 16 while maintaining a miniscule ERA of just 2.11
The Blues were solid too, going 9-5
but yielding a few games in the standings to their rivals in large part
due to reliever John Smoltz, who coughed up 3 wins in relief, giving up
20 hits in just 10 2/3 innings pitched. Ron Guidry was the best starter
(2.84 ERA, 4 G) but could only manage one win thanks to a bullpen that
was shaky at times.
Luckily, Cal Ripken batted .404 with a .596 slugging, and Willie
McCovey slugged .786 and scored 10 runs during the
week of games.
While playing just over .500, the
Black Sox did lowering their team ERA to 3.38, by far the
best in all of baseball. On the season, Randy Johnson is easily the
best pitcher in the game, giving up just 69 hits in over 90 innings of
work and his 2.45 ERA best by a wide margin. But the Black Sox also
rely heavily on Curt Schilling, who leads the league in wins, and Jason
Schmidt (5 W, 3.11 ERA). In fact, the only starter with an ERA below
league average is Pud Galvin. Their bullpen is talented – Mike Timlin
(0.55 ERA), Joe Nathan (1.67 ERA), Willie Hernandez (1.69 ERA), and Rick
Aguilera (1.86 ERA) can shut down games in the latter innings as the
team's
31-3 record when leading after 7 can attest.
Over in the
Union League, the
Manetheren Red Eagles had a good week, going 9-5 and capturing 1st
place. Thanks to a potent offense, the Red Eagles now have the best run
differential in the game. Hot on their heels though are the
Staten Island Dumpers and
Planet 10, both teams within a few games of first place. Planet 10
had been the division leader, but a 6-8 week halted their long stretch
atop the division.
From here on out I'll report on Wild
Card race, but it is much too early to pay close attention.
Remember, top two non-division winners, regardless of leagues, advance
to the playoffs.
* Currently tied for division lead
Other News / Notes
-
Art Vandalay’s
pitching staff is as bad as the Black Sox staff is good. Their
team ERA is 5.46, worst in ATB, and the 2nd worst team’s
is 4.80. No pitcher, reliever or starter, has an ERA under 4.00.
-
Jayson Stark reports that the
CosaNostra Deliverators are 13-2 when Jim Edmonds homers but
only 7-5 when Travis Hafner does.
-
John Olerud leads ATB in Game
Winning RBI’s with 11. 4 of these have been in the 8th
inning or later, and on
April 10, he did it twice, capping a 2-run game tying rally in
the 9th and later winning the game in extra innings with
a single.
-
On
May 26th versus the Deliverators, the Red Eagles
scored 10 runs in the 7th, breaking open a close 5-4
contest for good. Here’s what happened:
-
TWilliams grounded
a single up the middle (CX)
-
O'Neill,T walked, TWilliams to second (CBBbBB)
-
Dickey grounded out to short, TWilliams to third, O'Neill,T
to second (C>X), Flick pinch hitting for HJennings
-
Flick lined a double down the first base line, TWilliams
scored, O'Neill,T scored (X)
- Lynn
lined a double to right center, Flick scored (CX)
-
Tenney grounded a single up the middle, Lynn scored, Tenney
to second (BX)
-
Doyle grounded a single between third and short, Tenney to
third (X)
-
JMcGraw was hit by a pitch, Doyle to second (>FH)
-
Burkett lined a double to right center, Tenney scored, Doyle
scored, JMcGraw scored, Burkett to third on an error by the
second baseman Myer (BBCX)
-
TWilliams lined a single down the right field line, Burkett
scored (CFBBX)
-
O'Neill,T tripled deep to right center, TWilliams scored
(FX)
-
Dickey lined a single to left, O'Neill,T scored (BX)
-
Flick lined a single to left, Dickey to second (CBX)
- Lynn
flied out to center, Dickey to third (X)
-
Tenney lined out to first (BX)
Yes, that’s 10 consecutive
batters reaching base and on the inning the Red Eagles hit 6
singles, 2 doubles, 1 triple, walked once, and was hit by a pitch
once.
-
Finally, not sure how I missed
it, but on
May 5 Pete Rose broke up a no-hit bid by the Tax Evaders Steve
Carlton with 1-out in the 8th inning. Rose doubled,
Rafael Soriano followed with a home run, but the Ridgewood Houdini’s
did manage to escape with the win.
11/03/07 - Different
Approaches to Run Scoring
Through sim 5A six offenses have
separated themselves from the field of 16, scoring over 300 runs and
opening up a sizeable lead over the remaining 10 teams in terms of total
runs scored. Not coincidentally, each of these six are less
than 2.5 games out first place and as the summer heats up, these offenses
will look to take advantage of their runs scoring abilities.
Two of these teams however, have
additionally separated themselves from the "pack of 6" by scoring almost 6
runs per game. Interestingly, they have separate and distinct approaches to
run scoring:
- Team A is 1st in the league with
102 HR.
- Team B is 12th in the league, and
just 4 HR from being 14th (45 HR)
- Team B is an on-base machine, with
an incredible .387 team on base, a full 14 points better than the 2nd
best team.
- Team A has a team on base of .348,
just above league average.
- Team A is batting .290 / .348 /
.464, .8121 OPS
- Team B is batting .311 / .387 /
.425, .8124 OPS
Team A is the New York Blues, and
Team B is the Manetheren Red Eagles. Here's a brief look into each
starting lineup.

The Blues are obviously a dangerous
team. 7 of the 9 lineups slots are slugging over .450 when the
league average is just .405, and 5 of the top 25 HR hitters
in the entire game are on the squad. At current pace, they will
have just one regular fail to hit 15 HR, and an incredible 5 of them
will have hit 30 or more. Mickey Mantle is in the midst of a
historic season, with legitimate chances at 50 HR, 120 R, and 155 RBI
and finally, the teams #8 hitter Al Rosen, may reach 100 RBI before all
is said and done. All in all, with the exception of Mike Piazza in
the 8-hole, each person in the line-up is dangerous.
The Blues are 11-3 when hitting
3 or more home runs and have had just 7 games all season where they have
failed to hit at least one ball out the park. They happen to play
their home games in one of most prolific home-run hitting parks of all
time, but interestingly enough, they win just as often on the road as
they do at home.
Of course, as with any home run heavy
team, there is the potential weakness of getting shut-down waiting
for the 3-run home run that never happens. But the Blues seem to
account for this by batting .290 as team, and winning 13 of 20 when
hitting 'just' 1 home run. The most telling stat is the fact that
they don't consistently win until they score 6 or more runs. The
list below is the team's W-L in games they score "X" runs.
0: 0-1
1: 0-2
2: 2-5
3: 1-2
4: 6-3
5: 2-4
6: 4-1
7: 7-4
8: 4-0
9: 5-0
The Manetheren Red Eagles on the
other hand, are almost entirely scoring runs through attaining multiple
hits in an inning. They are built remarkably well for this thanks
to the fact the first 8 hitters in the lineup all get on base at clips
of .380 or better. And the first four of these players, led by
Ted Williams at .471, all get on base well above 40% of the time.
The Red Eagles have failed to score
at least 3 runs just 8 times this season and lead the league in games
(10) where they have scored 10 or more times. They lead all
offenses in Batting Average, On-Base, RC/27, TAVG, OPS, and K/BB ratio
for batters, yet are doing all this despite hitting just 0.8 HR's per
contest.
In their last 13 games, the Red
Eagles have averaged 7.7 runs per contest batting .363 / .437 / .498 as
a team.
Two teams. Two different
philosophies. Two great offenses.
10/24 - Week 3:
Union Domination (OLD SIM THAT WAS RE-RUN)
And in the blink of an eye the
Federal League is turned upside down. Last week at this time the
Rockaway Sleep Deprived Insomniacs held a 1.5 game lead, but more
importantly, looked to be one of the powerhouses of ATB. Fast
forward one Sim Week (14 games for them) and the Insomniacs are in
3rd place,
fighting to stay above .500. It was a truly awful week.
Their hitters posted a .239 AVG and .318 SLG while their rotation could
manage just 6 quality starts (43%); the two facts combined made them the
2nd worst team in the Sim at 3 wins against 11 losses, getting
outscored by
41 in the process.
Taking advantage of this slip were
the Dyersville Black Sox who now stand a few games over .500
after going 8-5. Pitching is the key to any sort of Dyersville
success. Their rotation is led by Randy Johnson (5-0, 2.20 ERA)
and Hank Aguirre (3-4, 3.73 ERA) but Jason Schmidt (4-3, 2.95 ERA) and
Curt Schilling (3-3, 4.12 ERA) have been impressive as well. Only
Pud Galvin has been worse than the league average in terms of ERA.
The bullpen head is Joe Nathan (2.30 ERA, league leading 13 saves) but
Willie Hernandez has been virtually unhittable, giving up just 10 hits
in 21+ innings of work. His ERA currently stands at a miniscule
0.86.
The worst team in the Sim, and
perhaps the worst team in the entire game, appears to be the Saginaw
Slammers. Despite playing the homer-happy
Baker bowl
the Slammers are scoring just
4.1 runs
per game, tied for 2nd worst in the game. Their slugging
average is well below the league average (.389 vs .401) which coupled
with their .237 team batting average has brought forth a disaster for
the pre-season playoff hopeful. The team is now 13-26 and 9.5
games back.
In the Union
League, Planet 10 had the best record thanks to a
stellar batting line (.307 / .373 / .436) and timely good starting
pitching (3.51 Team ERA). After another great Sim, Jack Chesbro is
6-0 with an ERA of 1.30. He finally had some help this week
though, as Luis Tiant (3-0, 3.20 ERA) and Denny McLain (1-1, 2.57)
pitched very well. Still, there is cause for concern since on the
season Planet 10 has still given up more runs than any other. The
two offensive hero's during the week were Barry Bonds (4 HR, 10 R, 13
RBI) and Oscar
Charleston (.433 / .469 / .600). Planet 10 surpassed the
CosaNostra Deliverators in the standings and now hold a 1.5 game
lead.
Other than the new 1st place teams
the main story of Sim 3 was the domination of the Federal League during
interleague play. Every game in Sim 3 was interdivisional, and
only one team had a losing record against the Union League (Staten
Island Dumpers, 4-10), with the rest combining for a 55-38 record
(.591 Wpct.).
On the season
the Federal League's record is a bit more even at 87-73 (.544 Wpct)
but a strong trend has certainly emerged. This is key as the the
two wild card teams are the ones with the next best records, regardless
of league, meaning a division is allowed to have 3 of the 4 playoff
teams. Here are each team's record in Inter League play:
Taking my Cuts (Tom Verducci Style)
-
The New York Blues Jonathan
Papelbon has been incredible, leading the league in a host of
pitching categories (minimum 50 batters faced). His ERA is
0.50; H/9 is 4.0, K/9 is 9.5, and WHIP is 0.72. He's the best
closer in the business at the moment.
-
But, he's not been as good as
Babe & Babe's middle reliever Keith Foulke. The right-handed
set-up man has a better H/9 (3.2), better K/9 (10.5), a better WHIP
(0.66), and better RCERA (0.86 vs. 0.94).
-
Only one team is undefeated in
all of a pitcher's starts, Planet 10 is now 7-0 when Chesbro takes
the mound. He's pitched 4 Complete Games (1 a shut-out) and
only Pedro Martinez has a better Quality Start %.
-
Russ Ford is a compete game
machine, finishing 6 of his 8 starts with an average of 117 pitches
thrown per game. Among starters with 5 or more starts, Clark
Griffith is throwing the fewest amount of pitches per game with an
average of 49. Yes, this is not a good sign (his ERA is over
7.00). Addie Joss is probalby the most proficient "good"
pitcher, averaging 86 tosses per game and he has 3 CG under his belt
plus an ERA under 3.50.
-
Three of the Top 6 RBI men are
Red Eagles (Fred Lynn, 38; Ted Williams, 37; Norm Cash, 36)
-
Over the past month, the best
team in the league has been CosaNostra (18-10); the worst team is
the Slammers (7-19); the best offense belongs to the Red Eagles (6.2
R/G) and best staff has been Babe & Babe (3.8 R/G).
10/22 - Looking at
the New Player Seasons (Batting Edition)
With
the influx of new owners to ATB IX we have seen a corresponding influx
of new players onto our player list. During the off season several
hundred 1800’s Players, Negro Leaguers, 2006 Players, and new draft
preferences from owners have increased our source database to an
astounding 509 batter-seasons and 433 pitcher seasons. These are truly
the greatest 1000 or so seasons of all time, at least within our
selection criteria.
Each
season owners undoubtedly think they are smarter than a previous owner
and either change the year used or draft outside the norm, looking for
the hidden gem to help take them to the title. What follows is a review
of some of these batting choices after 45 games of play. We’ll hit up
the pitchers next week, once the sample size grows a bit and the
starters have 10 games under their belts.
GOOD
CHOICES
Oscar
Charleston, 1925 – Planet 10
.354 /
.380 / .519, .900 OPS, 7 HR, 31 R, 28 RBI, 14 SB, 5 CS
Planet
10 took a gamble in selecting the Negro League center fielder with the
14th pick of the fourth round, which is of course very early
for a unknown quantity. It has paid off however – Charleston is in the
top 5 at his position, combining very good outfield defense with power
and speed. He leads all centerfielders in runs scored and is second in
Runs Created behind only Mickey Mantle.
Paul
Waner, 1928 – Absurdville Madness
.383 /
.434 / .518, .952 OPS, 1 HR, 13 R, 20 RBI
The
1934 version of Paul Waner has had mild ATB success in the past though
never given a true starting job (at least in recent memory). The
Madness selected Waner in the 14th round and he soon became
their #3 hitter against both lefties and righties. Shocking as that may
seem, the left-hand hitting right fielder has been great, leading his
team in Batting Average, On-Base Percentage, and Slugging. (Then again,
maybe this is more of an indictment of the third worst offense in the
game?)
Ty
Cobb, 1915 – Rockaway Sleep Deprived Insomniacs
.359 /
.432 / .473, .906 OPS, 3 HR, 28 R, 11 RBI, 15 SB, 6 CS
Cobb,
of course, has been a perennial powerhouse in ATB so it was more than a
mild risk for the Insomniacs to change the selection year to 1915.
Interestingly, this is now Cobb’s 4th different season tried
in ATB, and while in most cases owners try multiple seasons of a player
as a way figure out what’s wrong, in Cobb’s case it is more attributable
to how many great “real-life” years he’s had. The Insomniacs wanted
on-base percentage out of their lead-off slot and he’s currently 5th
in the league in the category.
Billy
Hamilton, 1894 – Babe & Babe
.320 /
.429 /.367, .796 OPS, 0 HR, 26 R, 8 RBI, 21 SB, 7 CS
A 6th
Rounder, Hamilton is living up to expectations and performing exactly
along the lines of his real life Hall of Fame career –high average,
great on-base, little power, and speed to burn. Given that Hamilton is
Babe & Babe’s lead-off hitter he is meeting all expectations leading his
team in Stolen Bases & On-base percentage, while maintaining 2nd
place in batting average and runs scored.
Josh
Gibson, 1938 – Fullerton Big Trains
.333 /
.393 / .625, 1.018 OPS, 9 HR, 23 R, 18 RBI
The
second Negro Leaguer to make this list, and the first catcher taken in
the draft (5th Round), Gibson is a powerhouse featuring a
.600+ Slugging Percentage and 1.000+ OPS, both easily the best marks of
any back-stop in the game. In fact, among qualified leaders at the
catcher position, Gibson is 1st in OBP, SLG, OPS, HR, R, and
RC. Unfortunately for Fullerton, he’s also the only batter hitting with
any consistency on the team.
Honorable Mentions
John
McGraw, 1899 – Manetheren Red Eagles (.481 OBP, 30 R)
Pete
Browning, 1887 – CosaNostra Deliverators (.343 AVG, 28 R, 20 RBI)
NOT-SO-GOOD CHOICES
Bill
Mazeroski, 1966 – Babe & Babe
.167 /
.180 / .217, 397 OPS, 1 HR, 6 R, 11 RBI
I
understand Maz is on the field everyday for his outstanding defense
(Ex/30) but can any team really carry a player with a .397 OPS?
Selected late (21st Round) it will be interesting to see how
long Babe & Babe sticks with the second basemen, especially with the
potentially powerful Jeff Kent waiting in the wings.
Robin
Ventura, 1999 – Fullerton Big Trains
.175 /
.206 / .206, .412 OPS, 0 HR, 8 R, 5 RBI
Robin
Ventura is in a similar position as Mazeroski having been drafted late
(24th) for mainly defensive purposes, but may soon find
himself out of starting job because his stick is simply too light. In
97 AB Ventura has hit just 3 extra base hits, all doubles.
Tony
Gwynn, 1987 – Seattle Tax Evaders
.235 /
.264 / .259, .524 OPS, 0 HR, 6 R, 7 RBI
In
perhaps the worst return on investment of any player drafted, Gwynn has
been a bust from the get go. The Tax Evaders must be second guessing
their draft choice for A) choosing 1987 (.370 /.447 / .511) instead of
1994 (.394 / .454 / .568) and B) choosing Gwynn so early. In ATB VIII
using the better 1994 season, Gwynn wasn’t drafted until the middle of
Round 19.
Joe
Torre, 1966 – Saginaw Slammers
.200 /
.245 / .320, .565 OPS, 4 HR, 10 R, 8 RBI
I am
pretty sure the Slammers recognized there were better years out there
for Torre (1970 & 1971) but the team philosophy was power at all costs.
Torre fit that mold for an 11th round catcher with his .568
SLG. In his defense, Torre has hit 4 HR, good enough for 4th
among catchers, and is 4th in shutting down the running game,
but the rest of his stats are terrible.
Jose
Reyes, 2006 – Planet 10
.268 /
.294 / .289, .583 OPS, 0 HR, 16 R, 8 RBI
If
there is one thing long time ATB’ers know to stay away from its low
average batters with minimal walk rates. Of all players drafted for ATB
IX, Reyes was in the bottom 13% in terms of Walks per Plate Appearance
and when adding in the fact that he’s batting “just” .300 (235th
of 281 batters) his name on this list is not all that surprising. I am
guessing Planet 10 knew this as well since he was drafted in the 28th
round, and taken 19 rounds after the team’s 1st choice at
shortstop – Nomar Garciaparra.
This
is probably a good place to mention that the ‘real-life’ league average
batting lines and pitching lines are
.331
AVG, .415 OBP, .559 SLG
2.01
ERA, 0.98 WHIP, 6.5 K/9
Honorable Mentions
Roberto Alomar, 1999 – Fullerton Big Trains (.207 AVG)
Craig
Biggio, 1998 – Ridgewood Houdini’s (.288 OBP, .285 SLG)
David
Wright, 2005 – Santa Cruz Honking Seals (.575 OPS)
10/17 - Week 2 -
Making Statements
Long time ATB
regulars, Mike Smitko and Justin Petronzi, each made strong statements
this week about who is to be crowned ATB king. Going a combined 20-7,
and outscoring their opponents by 55 runs, both the CosaNostra
Deliverators and Rockaway Sleep Deprived Insomniacs forged
their way into first place after roughly one month of play. On the
season the two rivals are ranked one-two in run differential, and each
feature a balanced attack through high powered offenses and very good
rotations.
The key to the
Deliverators attack is their powerful
1-3 batters,
each with excellent on-base percentages ranging from .389 to .424.
“Gladiator” Pete Browning, Wade Boggs, and Shoeless Joe Jackson may not
have the power to match up against several other teams, but the three in
tandem are a force to be reckoned with. Browning is batting .360 with
18 Stolen
Bases and 16 Runs Scored; Boggs is batting .299 with a on base
percentage hovering around .390; and Jackson is the catalyst batting
.351 with 8 doubles and 20 runs scored. Behind these three several
players of opportunity who drive in runs – Jim Edmonds (5 HR, 13 RBI),
Travis Hafner (4 HR, 11 RBI), Darren Daulton (4 HR, 8 RBI in a platoon
with Javy Lopez), and Nap Lajoie (10 XBH, 16 RBI) stack up against
almost any lineup.
The success of
their pitching
rotation starts with Pedro Martinez (2.96 ERA, 49 K) but several
lesser-known pitchers are driving the overall success for CosaNostra.
Silver King (2.92 ERA), Russ Ford (4-1, 1.73 ERA), and Derek Lowe (1.90)
are all pitching extremely well and the relief corps as a whole are
allowing just 28% of their inherited runners to score (league
average is 34%).
Rockaway, a
team if your recall that had the overall pick in the draft, managed to
put together a pretty good
rotation -
Tommy Bond (3.92 ERA, Monty Stratton (4.28 ERA), Ted Lyons (3.30 ERA),
and Guy Hecker (1.29 ERA) are all consistent, but the key to this team’s
pitching success appears to be its bullpen. Closer Eric Gagne has been
un-hittable, giving up just 10 hits in 13 2/3 innings while striking out
an incredible 28 batters. Gabe White (13 IP, 11 H, 1 BB, 11 K), Pat
Jarvis (14.2 IP, 12 H, 6 K), Eddie Plank (11.2 IP, 1.54 ERA), and to a
certain extent Takashi Saito (12 IP, 17 K, but 18 H) are all feared and
together can shut down the late innings of a game, as evidenced by a
team record of
14-0 when leading after 7 innings.
Their
offense may
be the best in the game considering the ballpark they play in (Skydome):
1) Ty Cobb -
.458 / .536 / .597, 15 SB, 21 R
2) King Kelly -
.390 OBP, 14 R
3) Arky Vaughan -
.301 / .383 / .484, 11 2B, 21 RBI
4) Dan Brouthers -
.310 / .367 / .494
5) Reggie Jackson -
.313 / .371 / .672, 5 HR, 16 R, 17 RBI
6) Ed Delahanty -
.368 OBP, 9 2B
7) Jim Thome -
8 HR, 19 RBI
8) Tommy Holmes -
.391 / .434 / .551
9) Lou Whitaker -
.713 OPS vs. second base average of .655
Elsewhere, in
the Union League Babe & Babe
(8-4) and the Ridgewood Houdini’s (8-3) had great weeks. In 12
games, Albert Pujols and Babe Ruth combined to hit 11 HR 26 RBI for the
B&B Squad, while player of the week Kevin Brown picked up three wins and
closer Bruce Sutter was perfect in 4 of his save opportunities. The
Houdini's won well and won often thanks to 3 wins from Christy
Mathewson, a 2.35 ERA in 3 starts from Roy Halladay and Brett
Saberhagen, and a monster 47 at bats from George Brett - .368 / .510 /
.936, 6 HR, 14 R, 15 RBI.
Over in the
Federal League, the NY Blues
(8-4) and Dyersville Black Sox (9-4) were other standouts. The
former batted .298 / .364 / .492 scoring 78 runs and the latter bested
them by 2, scoring 80 thanks to a line of .310 / .358 / .468.
It's too early to worry about playoff
slots just yet, but the rest of the Federal Leaguers should take notice
that only two teams have records better than .500 and the rest of the
division is already at least 4.5 games back.
Finally for this week, it is time to
recognize a team that is in trouble. Art Vandalay is likely
doomed, and I can say this because I haven’t heard from the owner since
the middle of the draft. There may be a reason why he bailed – he’s
compiled a team with the worst ERA by far (6.01), which coupled with a
team batting average of .243 makes Vandalay historically significant for
less than positive reasons.
*******
5 Thoughts While My Daughter Falls
Asleep
-
The ATB world has been turned
upside down on the basepaths. Stolen bases are at the highest
levels in recent memory with only three teams on pace for the less
than 100. Last year there was a stolen base every 47 At Bats,
this year it's every 34.
-
Hank Aaron (Saginaw Slammers)
has typically been an ATB bust of the highest magnitude. Two
different years have been used ('59 and '71) but he has never looked
like the Hall of Famer he is. This year however, and perhaps
it is the Baker Bowl (and if you haven't, please check out the
ballparks
page to see what your stadium looks like), he's 2nd in home runs and
batting over .300. Good for you Hank.
-
The 1800s players are making a
decent enough show of it. 12 batters have had 60 Plate
Appearances so far, and 5 have hurt their teams. For pitchers,
it is the opposite with 6 of 10 not working out to date:
-
The great Walter Johnson
(Fullerton Big Trains) may be in hell. In real life he played
for teams with a combined record of just 1559-1609 (.492 Wpct) but
yet had a stellar 417-279 record himself. His ATB team is
struggling right now, last in the Federal League at 10-16 and with
the second worst offense to boot. Yet, he perseveres in sim
life too: 4-2, 2.54 ERA, 49.2 IP, 36 H.
-
During the draft the race for the
most Home Runs was won by the NY Blues over the Slammers 574
to 568. To put those numbers into perspective, the average ATB
team has 442 Real Life home runs and the Staten Island Dumpers
have just 327. Despite playing in less of a home run hitters
park (but still, it is Coors Field) the NY Blues hold a
slight edge in team home runs 49-42.
10/10 - Week 1
is Done
Who said owner experience matters in ATB? After
Week 1 there are surprises abound, at least if you subscribe to the theory
that in order to win the game, you need to know the
game. Returning ATB'ers have a combined record of just 60-60 and
3 of the top 5 teams in terms of standings are owned by rookies.
In the Union League
the Absurdville Madness stormed out to a an 8-3 start before
dropping 3 of their next 4. A true small ball team, with 46
Stolen Bases and just 6 home runs to date, they find themselves in
the upper half of the league in terms of runs scored. Maury
Wills is leading the team in bags swiped with 11, and Ricky
Henderson (8) and Paul Molitor (6) are 2nd and 3rd on the
team respectively. Perhaps the bigger surprise is their starting
pitching which is fairing very well. In 'real life' the names
Sandy Koufax, Jim Palmer, Carl Hubbell, and Vida Blue evoke
memories of all-time greats. In ATB they represent some of the
worst underachievers we have ever seen and yet the four of them have a
combined ERA of 2.99.
Another ATB first time team is that of Planet 10.
In the midst of a 4-game winning streak they now sit tied atop of the UL
with a 9-4 record. Their number one starter, Jack Chesbro,
has been stellar, holding opponents to just 17 hits in 26 innings with a
0.69 ERA en route to an undefeated record in three starts. The
offense has been led by a trio of modern day players and a Negro
Leaguer. With superb outfield defense, Oscar Charleston
(.362 / .367 / .569, 3 HR, 11 RBI) leads the team in Runs Created while
Barry Bonds, Brian McCann, and Nomar Garciaparra have hit
5 HR and driven in 16 in the early goings of the season.
The Staten Island Dumpers are likely the best team
after the first week of play. They are just one game behind the County
Wicklow Fighting Shillelaghs who own the leagues best record, and have the
best run differential in the game. This, despite a intense brawl
with the Manetheren Red Eagles on
April 12
that cost them their 2nd and 3rd starters for approximately 3 - 4 weeks. As best can
be discerned, which is difficult since the players are refusing to
speak, starting pitcher Al Orth drilled Manetheren's second batter of
the game, Hughie Jennings. Benches cleared, and Orth was not only ejected
from the game but suffered a horrible month long injury as well. To add
to the insanity, one of the players off the Dumpers bench was Kid
Nichols who also took a beating, and is out almost three weeks.
Not lost during the sim was the Red Eagles propensity for
violence. Just 6 days later, this time against the Ridgewood
Houdini's, the Manetheren squad was in another brawl. In a tie
game heading to the bottom of the eighth, the home Red Eagles stroked
back to back singles to open the inning. Houdini reliever Kent Tekulve
then lost control of fastball and plunked second basemen Davey
Johnson. Johnson didn't take too kindly and charged the mound -
benches cleared for the second time in a week and this time the
casualties were on the Red Eagles side. Reliever JJ Putz is out 17
days, and back up outfielder Jimmy Sheckard 11 days. Why Johnson
thought Tekulve would intentionally hit him to load the bases with
nobody out in a late inning tie game is beyond all comprehension
Over in the Federal League,
the aforementioned Fighting Shillelaghs have the best record at 10-5.
They were a great team during the exhibition season and didn't lose a
step in starting the season. Teddy Higuera (2.66 ERA), Cliff
Melton (1.44), and Chris Carpenter (3.20) have all been well above
league average while outfielder Sherry Magee was a player of the week
candidate.
The highest scoring offense belongs to the second place
NY Blues. They are scoring 5.2 runs per game thanks to a
league leading 25 HR and .440 team slugging percentage. This
coupled with above average hitting (.276) makes them a force. Of
course, they play their home games in Coors field which has it's
downside - Bob Gibson, Ed Reulbach, and Jack Pfiester each have ERA's
above 6.50.
**********
Being the first week wanted to make sure everyone knew
what reports/fun stuff is out there. Each week the ATB home page
will have a few custom reports. Directly below the write-up are four of them:
The Good, The Great, and the Ugly - my vote for
the current best and worst players in the game.
Batters and Pitchers of the Week - Weekly
scorecard for the Players of the Week.
Power Alley - Team rankings based upon W-L record
and Pythagorean Record (Runs Scored and Runs Against)
Top Players - best players at each position.
There are also 4 reports listed on the top left of the
home page
-
Great Individual
Feats (3 HR Games, 6+ RBI Games, 12K+ games, etc)
-
RSAA Leaders (Pitcher rankings by position)
-
AOPSAP Leaders (Batter rankings by position)
-
Standings Charts (Graph of the standings)
******
Oh, and curious as to what was in the minds of our owners as they named
their teams?
Absurdville Madness
Art Vandalay
Babe & Babe
CosaNostra Deliverators
County Wicklow Fighting Shillelaghs
Dyersville Black Sox
Fullerton Big Trains
Manetheren Red Eagles
New York Blues (maybe)
Planet 10
Ridgewood Houdinis
Rockaway Slp Dprv Insomniacs
Saginaw Slammers
Santa Cruz Honking Seals
Seattle Tax Evaders
Staten Island Dumpers
10/05 - Opening
Weekend
You can't
sit on a lead and run a few plays into the line and just kill the
clock. You've got to throw the ball over the goddamn plate and give
the other man his chance. That's why baseball is the greatest game
of them all. ~Earl Weaver
Baseball
is a harbor, a seclusion from failure that really matters, a playful
utopia in which virtuosity can be savored to the third decimal place
of a batting average. ~Mark Kramer
Opening day
is upon us and those two quotes are a fitting introduction to ATB IX.
We’re in the midst of football season and yet 16 of us “sports” fans
found the time to spend three weeks in front of a message board
drafting fantasy baseball players – and not just any players, literally
from a cast of 20,000 or more options. The kind folks at DMB allow us
to participate in what I can only describe as the ultimate fantasy
baseball format, and hopefully ATB lives up to expectations.
The second
quote I relate to wholeheartedly, having completed rankings of every
single player who ever lived just for the purpose of ATB. I can attest
I have most assuredly avoided batters because the 3rd decimal
place of his batting average wasn’t up to snuff. I know some of you are
the same way.
But really I
hope we get past the numbers behind ATB and use our imaginations. At
lunch one-day this past mid September a few colleagues of mine, one of
which participates in ATB, were discussing the 2001 World Series, and
game 7 specifically. As a Yankee fan I felt acid in the pit of my
stomach at the thought, but when we got back to our desks we still
forced ourselves to go to basebaball-reference.com and look at the
box score.
One simple
box score, 6-years old, lent us 20 or more minutes of discussion about
the fateful game, and specifically the dreadful 9th inning.
In front of us is the prospect of 2,500 box scores.
Breaking News
Several teams
break camp today announcing their starting rotations, and 2007 opening
day is to be kicked off with some of the best match-ups in the history
of the sport.
Planet 10 @ Babe & Babe
Jack Chesbro
(41-12, 1.82 ERA, probable) vs. Johan Santana (20-6, 2.61 ERA,
probable)
Staten Island Dumpers @ Ridgewood Houdini’s
Pete Alexander
(31-10, 1.22 ERA) vs. Christy Mathewson (31-9, 1.28 ERA,
probable)
Absurdville Madness @ 89 Smitko’s
Sandy Koufax
(27-9, 1.73 ERA) vs.
Pedro
Martinez (18-6, 1.74 ERA)
Manetheren Red Eagles @ Art Vandalay
Cy Blanton
(18-13, 2.58 ERA) @ Dwight Gooden (24-4, 1.53 ERA)
Rockaway Sleep Deprived Insomniacs
@ Seattle Tax Evaders
Harry Brecheen 20-7, 2.24 ERA vs.
Lefty Gomez (21-9, 3.67 ERA, probable)
NY Blues @ Brad Peterson
Bob Gibson (15-2, 1.75 ERA)
vs. Addie Joss (24-11, 1.16 ERA, probable)
County Wicklow Fighting Shillelaghs @ Saginaw Slammers
Greg Maddux
(19-2, 1.63 ERA) vs. Babe Adams (17-10, 1.98 ERA)
Fullerton Big Trains @ Dyersville Black Sox
Walter
Johnson (36-7, 1.14 ERA) vs. Randy
Johnson (16-14, 2.60 ERA)
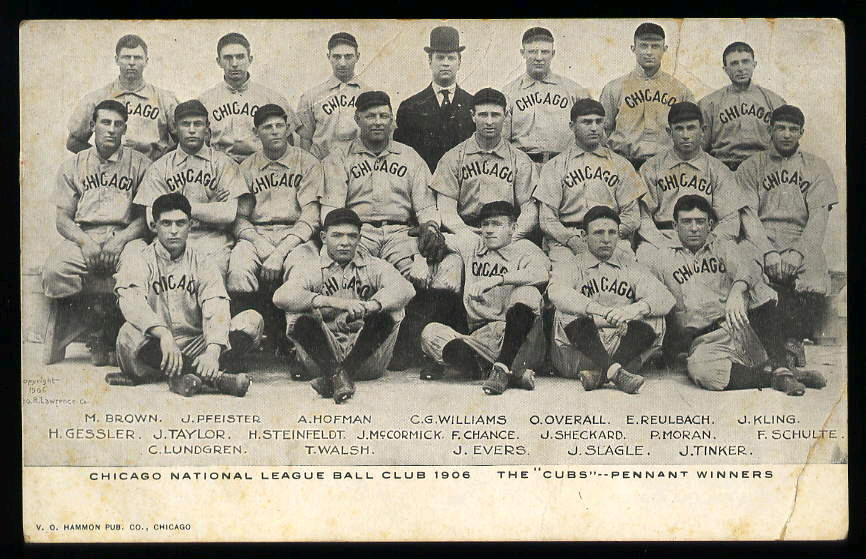
09/11 - Greatest
Pitching Staff of All time
I am out of time to look at this in
depth, but wanted follow up on last week's post on the best team offense
since 1901. And ff course, one can't talk best offenses without following up on
the best pitching staffs. For long time ATB'ers it will come as no
surprise that the 1906 Cubs (115-37), with an amazing rotation of
Mordecai Brown, Jack Pfiester, Carl Lundgren, Ed Ruelbach, plus Orval
Overall and and Jack Taylor, get the nod for best staff of all time.
In early days of ATB, three-quarters of these starters were 1st round
picks, each dominating the league like virtually no other. Times
have changed, ATB has switched to new software which is a bit unkind to
early 1900's pitchers, but their legacy's live on.
Before getting to their stats we need
to make the same caveat as we did with the batters. If using team
ERA versus League Average ERA as a judge for best pitching staff, a host
of 1800's clubs top the list. In one of the first years we have recorded stats,
1876, the St. Louis Brown Stockings had a team ERA of 1.22, aided in
part by 268 team errors which kept ERA's very low. 268 errors
happen to the best in the league at the time, but it still works out to
be a whopping 4 per game. So, while the team ERA was 1.22 the
Brown Stockings were giving up over three and a half runs per game.
Here was their rotation and relief corps:
George Bradley
Not a typo of course. Back in
the early days of organized baseball a team had just one pitcher, and
while George Bradley was one of the best, his accomplishments alone can
not give the Brown Stockings the best staff of all time.
Before listing the '06 Cubs stats,
here is the best team ERA's by decade:
Note: The post is titled Best
Pitching staffs, but of course team defense is tightly intertwined with
good pitching.
Regular Pitchers for the 1906 Cubs:
Player
ERA W L SV CG IP
H BB SO ERA+
Mordecai Brown 1.04 26 6 3 27 277.3
198 61 144 253
Jack Pfiester 1.51 20 8 0 20
250.7 173 63 153 174
Carl Lundgren 2.21 17 6 2 21
207.7 160 89 103 119
Ed Reulbach 1.65 19 4 3
20 218.0 129 92 94 159
Jack Taylor 1.83 12 3 0
15 147.3 116 39 34 143
Orval Overall 1.88 12 3 1 13
144.0 116 51 94 140
Keep in mind that the last column, ERA+, includes an
adjustments for both league and park, and the Cubs overall team score of 150 has
never been approached by another team, save the Cubs squads of '05, '06,
'07, and '09. With a 5 year run as this team had during the latter
part of the first decade of the 20th century, they are easily the best
pitching staff in the history of baseball. Imagine, the worst pitcher on the staff
going 17-6 with a 2.21 ERA.
For the record, the Cubs ERA+ from 1905 through 1909:
145
150
144
110
146
The Cubs of this period also had the
famous "Tinker to Evers to Chance" double play combination.
Below is a 1906 Cubs Postcard
published by Suhling & Koehn, featuring a photo by F.P. Burke.
09/10 - T-minus 7
Days
The Draft will begin promptly at
9:00 AM NEXT MONDAY, SEPTEMBER 17.
Before getting into mechanics, please, go to the
Message Board and
register. If you already have an ID from past leagues, log on
prior to draft day and make sure you can still get in. An owner's
turn will be skipped if he simply can't get to the draft board, and
didn't notify my of an issue earlier.
How it Works
-
There are only two threads in the
message board, one for me to accumulate draft picks and one for you
to post your picks
-
Go to the ATB IX Forum
-
The thread titled "DRAFT
DAY RESULTS - ALL ROUNDS COMPILED HERE" is where I post
draft status. Please use this thread for reference, so you
know who is off the board.
-
The thread
titled "Owners
Make Individual Picks Here" I hope is self explanatory.
You post your pick here, I will re-post it in the first thread.
Each owner is pre-assigned a specific
1/2 hour block of time to make a selection. If you miss your block
of time, you are skipped, and the next owner is allowed to make a
selection once his 1/2 hour block of time has started. The skipped
owner can go back and make the missed selection at any time
thereafter.
The goal is not to adhere to these
blocks of time, rather, the goal is to get through the draft as quickly
as possible. The 1/2 hour increments are only there to enforce
that slow owners make their picks in a timely fashion. We all have
jobs, well, I think we do anyway, and some of us have family - so it is
expected that at certain times we can't make our allotted time
schedules. This is OK - just let me know ahead of time and we will
make alternative arrangements.
In general, the draft runs from 8 AM
to 10 PM each weekday, with the exceptions being a later start on Monday
morning, and an earlier finish on Friday evenings. For those who
can't make early picks (for example, Kevin Crowley is up at 8 AM on
Tuesday) - you can email me your pick the night before.
Owners can also submit lists to me,
in order of preference, and I will post a pick for them if they wish.
This is not recommended, but can be accommodated.
Here is the schedule for next Monday
and Tuesday. In the hopes that we go quickly, I will publish
Wednesday and Thursday schedules after the draft begins.
And remember - quicker is better, we
can draft all night long if the next owner up continues to make a
selection!
09/05 - The Best
Offense
A great offense is undoubtedly one
that scores more runs than the competition. In the same vein, an
argument can be made that the best offense is one that has had
the widest margin of runs scored versus the league average.
Looking at historical teams in this manner we find a host of 1800's
teams - the top 23 of all time to be exact, are all from 1891 or
previously. This is due to the relative lack of competition during
the era, in extreme cases having terrible teams fold just weeks into the
season.
For example, the 1875 Boston Red Sox
scored 155% more runs than the league average, compiling a whopping 71-8
(.899 Wpct) record along the way. You'll notice that this team
played only 79 games, which while more than a typical full season at the
time, is much less than the number of games played in modern times.
Much of the competition was awful - The Keokuk Westerns played just 13
games; the Philadelphia Centennials just 14; the St. Louis Red Stockings
just 19; the Washington Nationals just 28; the Brooklyn Atlantics just
44; and the New Haven Elm City's just 47. These teams had
abysmal records, with the best of them having a .211 Winning Percentage
(4-15) and as a group won just 21 of 165 contests, which yields a
horrific .127 Winning Percentage. Its no wonder the Boston Red Sox
were able to destroy their competition, scoring 10.1 runs per game while
their pitchers gave up just 4.2.
Should we consider the '75 Red Sox to
have the best offense ever? Probably not.
Another tool we can use is a
sophisticated formula developed by Bill James that measures competitive
balance for each decade throughout baseball history. I don't
understand the math, but James has done enough in the field of
Sabermetrics that he doesn't have to explain his stuff to us. Here
is "Index of Competitive Balance" by decade, the higher the number the
more competitive:
1870s - 21%
1880s - 24%
1890s - 27%
1900s - 30%
1910s - 36%
1920s - 34%
1930s - 31%
1940s - 34%
1950s - 34%
1960s - 40%
1970s - 45%
1980s - 56%
1990s - 57%
The book (The New Bill James
Historical Abstract) the above data is taken from was published in
2001, so we don't have an exact number of what the 2000s will bring, but
it is safe to say it will be the most competitive on record.
I am not sure where our cut-off
should be (is 27% more meaningful than 30%?), but lets make in 1901, or
the time when the two league format re-formed and stuck for good.
Previously the competition was not up to snuff, the three least
competitive decades on record.
Who is best of modern times?
The 1902 Pittsburg Pirates, managed
by future Hall of Famer and then-current player Fred Clarke, were a
juggernaut, finishing the season with a stellar 103-36 record (.741
Wpct, 2nd best in post 1900 history) and claimed first place by 27.5
games. They scored 775 runs, 142 more than the second best Reds,
and 39% more than the league average. Their home games were played
in
Exposition Park - a
monster
with 400 ft foul lines and with dead center standing 450 ft away from
home plate.
While we don't have lineup order
data, this is a likely representation of the most common (in a league
that hit .259 / .313 / .319, 100 OPS+):
P Player
G AB R H 2B 3B HR RBI AVG OBP
SLG OPS+
3B Tommy Leach 135 514 97 143 14 22
6 85 .278 .341 .426 132
OF Fred Clarke 113 459 103 145 27 14
2 53 .316 .401 .449 157
OF Honus Wagner 136 534 105 176 30 16 3
91 .330 .394 .463 159
OF Ginger Beaumont 130 541 100 193 21 6 0 67
.357 .404 .418 149
1B Kitty Bransfield 102 413 49 126 21 8 0 69
.305 .336 .395 121
2B Claude Ritchey 115 405 54 112 13 1 2
55 .277 .370 .328 112
SS Wid Conroy 99 365 55
89 10 6 1 47 .244 .299 .312 85
C Harry Smith 50 185 14
35 4 1 0 12 .189 .211 .222 31
Fred Clarke and Honus Wagner are Hall
of Famer's; Tommy Leach and Ginger Beaumont would have been perennial
All-Stars had the mid-season classic been played during the time; and
Claude Ritchey and Kitty Bransfield were above average and well above
average respectively in 1902.
Clarke also shuffled his bench
extremely effectively. The glaring weak spot on offense was the
defensive minded catcher, Harry Smith, who was anemic at the plate.
But he was one of three catchers in a platoon-type situation that had
312 At Bats (to Smith's 185) coming from about league average hitters,
and well above league average hitters for catchers of the age.
Jack O'Conner batted .294 / .306 / .341 (96 OPS+) and Chief Zimmer, and
aging star from the 1890's, had a good for the time on-base percentage
of .338.
The other below average offensive
player was the shortstop Wid Conroy. Wagner of course, was a
shortstop by design, and 1902 was the last year he played more games
elsewhere until his 40's. This year however, the Flying Dutchman
did play over 40 games at short which helped mitigate the weak stick of
Conroy. When Wagner was manning the infield, his outfielder
replacements were very good:
P Player
G AB R H 2B 3B HR RBI AVG OBP SLG
OPS+
OF Lefty Davis 59 232 52 65 7
3 0 20 .280 .377 .336 116
2B/OF Jimmy Burke 60 203 24 60 12 2 0 26
.296 .359 .374 122
OF Jimmy Sebring 19 80 15 26 4 4
0 15 .325 .365 .475 154
Even starting pitcher Jesse Tannehill
had luck with the bat, so good in fact, he was called upon to pinch hit
or play the outfield in 16 games. For the year, he batted .291 /
.348 / .365, good enough for a 116 OPS+ score.
There is a cloud of suspicion over
the greatness of the 1902 Pirate club. It is important to remember
that the American League formed in 1901, and league president Ban
Johnson wooed 45 of the best National League players over to his side,
with none of them coming from the Pirate franchise. This left the
team in great shape to soundly beat their NL competition. There is
even speculation of how hard they had to try down the stretch, from the
Baseball Library:
The Pirates were indeed dominant,
but their competition was a joke. Never was it more obvious than on
the last day of the season, when the Pirates set a major-league
record with their 103rd win -- with more than a little help from the
opposing Cincinnati Reds. The Reds -- who had hoped to cancel the
game on the grounds that the rain-soaked field was unplayable --
spent the day switching positions at whim and generally clowning
around. One batter came to the plate smoking a cigarette. With first
baseman Jake Beckley on the mound, pitcher Rube Vickers took his
turn behind the plate and promptly set a major-league record with
six passed balls. As each sailed to the backstop, Vickers stood and
slowly blew his nose.
With this in mind, I present a
summary of the teams with the best offenses by decade:
There are of course, several ways to
dissect the data, one of the being paying more attention the individual
players that comprise a lineup instead of a team's absolute runs scored.
You would be hard pressed to find a better every day lineup than the
1927 or 1931 Yankees. Also, please note the 1996 Rockies were
mostly good because of their park, which is evidenced by a team 100 OPS+
rate despite a whopping 961 Runs Scored.
A handful of the players referenced
above are ATB regulars, and here are their statistics from last year:
-
Lou Gehrig, 1927 - .279 / .370 / .569,
45 HR, 110 R, 115 RBI (not 1931)
-
Joe Morgan, 1976 - .227 / .351 / .417,
25 HR, 116 R, 95 RBI
-
Robin Yount,1982 - .297 / .325 / .468,
56 EBH
-
Pete Rose, 1965 - .253 / .279 /
.323 in 158 AB
A few others have been drafted in
prior years, but not in ATB VIII:
-
Frank Baker, 1913. His 1912 year
was chosen.
-
Ben Chapman, 1931. No season of
his was used.
More have had other seasons drafted
in ATB, but never the one referenced above:
-
Honus Wagner, 1902.
1908 has been used previously.
-
Eddie Collins, 1913. 1909
and 1914 have been used previously.
-
Babe Ruth, 1927/31.
1920 and 1921 have been used previously.
-
Stan Musial, 1942.
1948 has been used previously.
-
Ted Williams, 1948.
1941 has been used previously.
-
Frank Robinson, 1965. 1966 and
1951 have been used previously.
-
George Foster, 1976. 1977
has been used previously.
-
Ellis Burks, 1996.
2000 has been used previously.
-
David Ortiz, 2003.
2004 and 2005 have been used previously.
-
Manny Ramirez, 2003. 2000
and 2002 have been used previously.
Finally, most of these great seasons
on great offenses have never been tried in ATB history, perhaps this is
the year:
-
Ginger Beaumont, 1902
-
Fred Clarke, 1902
-
Earl Coombs, 1927
-
Cecil Cooper, 1982
-
Walt Dropo, 1950
-
Ken Griffey, Sr., 1976
-
Deron Johnson, 1965
-
Tommy Leach, 1902
-
Snuffy McInnis, 1913
-
Bill Mueller, 2003
-
Bob Muesel, 1927
-
Trot Nixon, 2003
-
Enos Slaughter, 1942
-
Gorman Thomas, 1982
9/4 - Player Profile:
Lefty Grove
 |
“Lefty Grove
could throw a lamb chop past a wolf.”
…Arthur Baer
Lefty
Grove is likely the greatest left-handed pitcher of all time,
and can arguably be called the greatest overall pitcher in the
history of the sport. Consider that his ERA, for his career,
was 48% better than the league average (adjusting for park) –
the best mark of any pitcher who is no longer active. Better
than Walter Johnson. Better than Cy Young. Better than Grover
Alexander, Addie Joss, 3-Finger Brown, Sandy Koufax, and scores
of other all time greats.
Grove
had a late start to his major league career, not being sold to
the majors until his was 25. It is important to remember that
the minor leagues of his time were not owned and operated by
major league clubs; instead, they were almost entirely
independent of the American and National Leagues. In cities
where a major league team did not exist, the minor league team
won the hearts of the fans and across America many followed
these independent teams just as fervently as any major league
one.
This
was true in Grove’s case as well. He played exceptionally for
the Baltimore Orioles from 1920-1924, and owner Jack Dunn
refused to part with his talented young lefty for years.
Finally, in 1925 Dunn sold him to the Philadelphia Athletics
for a then-record $100,500. While with Baltimore, Grove
compiled a record of 97 wins against just 34 losses, leading the
International League in strikeouts each year, and with his last
season being an astounding 27-6 campaign. |
His best
season in the majors was undoubtedly 1930 when he went 31-4 with a 2.06
ERA; this in a league where the average ERA was 4.51 and in a park that
favored batters. He won back to back pitching triple crowns in ’30 and
’31, won the MVP in ’31, led the league in strikeouts 9 times (finished
in the top ten in 12 of 13 seasons after his rookie campaign), and
routinely had the best K-BB ratio of virtually each season. He also had
eight 20-win seasons and twice struck out the side on 9 pitches.
Lefty Grove’s
legacy is also one of wrath, as also led the league in "shredded
uniforms, kicked buckets, ripped-apart lockers, and alienated
teammates." While his skills are perhaps unrivaled in the history of
sport, Grove was a bitter angry player, prone to bouts of rage. "Opposing
teams' baseball fans would flock to the ballpark and "boo" and curse
Lefty because of his reputation of throwing at opposing batters heads”,
he complained his teammates were lousy players, and even at times upset
his peaceful and stoic manager, Connie Mack.
The most famous of these incidents happened in 1931 when Grove was
pitching for his 17th consecutive win which would have tied
an American League record. Teammate and Right Fielder, Al Simmons, took
this day off to see a physician and his replacement misplayed a ball
which led to the only run being scored in the game. Grove never forgave
him, "After I lost that game, I came back and won six or seven in
a row," Grove recalled years later, still fuming. "I would have had 24
if Simmons had been out there where he belonged."
Grove was elected to the Baseball Hall of Fame in 1947 with
76.4% of the vote.
In ATB VIII last season, Grove was the #2 pitcher
on the PC-led Bayou Big City Oil squad. He went 10-11, 5.09 ERA,
179 IP, 202 H, 69 BB, 144 K. He was drafted in the 3rd round, 44th
overall.
|
CAREER STATISTICS - LEFTY GROVE
Year Ag Tm W
L GS CG SV IP H
HR BB SO HBP ERA WHIP
1925 25 PHA 10 12 18 5 1
197 207 11
131 116
5 4.75 1.72
1926 26 PHA 13 13 33 20 6
258 227 6 101
194
6 2.51 1.27
1927 27 PHA 20 13 28 14 9
262.3 251 6 79
174
2 3.19 1.26
1928 28 PHA 24 8 31 24 4
261.7 228 10 64
183 1
2.58 1.12
1929 29 PHA 20 6 37 19 4
275.3 278 8 81
170
3 2.81 1.30
1930 30 PHA 28 5 32 22 9
291 273 8 60
209
5 2.54
1.14
1931 31 PHA 31 4
30 27 5
288.7 249 10 62
175 1
2.06
1.08
1932 32 PHA 25 10 30 27 7
291.7 269 13 79 188 1
2.84
1.19
1933 33 PHA 24 8
28 21 6
275.3 280 12 83 114 4
3.20 1.32
1934 34 BOS 8 8 12 5
0 109.3 149 5 32
43 1 6.50 1.66
1935 35 BOS 20 12 30 23 1
273 269 6 65 121
3 2.70
1.22
1936 36 BOS 17 12 30 22 2
253.3 237 14 65 130 4
2.81
1.19
1937 37 BOS 17 9 32 21 0
262 269 9 83 153
1 3.02 1.34
1938 38 BOS 14 4 21 12 1
163.7 169 8 52 99
1 3.08 1.35
1939 39 BOS 15 4 23 17 0
191 180 8 58
81 1 2.54 1.25
1940 40 BOS 7 6 21 9
0 153.3 159 20 50 62
1 3.99 1.36
1941 41 BOS 7 7 21 10
0 134 155 8 42
54 2 4.37 1.47
CAREER
300 141 457 298 55 3940.7 3849 162 1187 2266 42 3.06
1.28 |
 |
8/31 - Player Profile: Tris Speaker
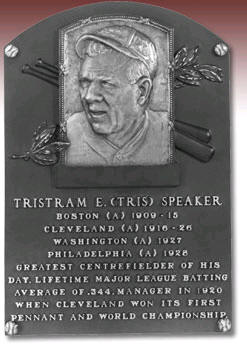 |
To the casual baseball fan,
Tris Speaker is perhaps the most underrated player with a plaque
hanging in Cooperstown's Baseball Hall Of Fame.
Overshadowed for much of his career by the popular and vocal Ty
Cobb, Speaker also had his best seasons during a time when Babe
Ruth was the king of Baseball. In truth, Speaker was an
awesome Centerfielder who hit for average, power and was
considered the best fielding outfielder of his time. He
is:
- 6th all time in
career batting average (.345)
- 11th in Runs Created
(2154)
- 12th in OBP (.428)
- 16th in OPS+ (158)
- 1st in Doubles (792)
Speaker's best season was
probably 1912 when he won the Chalmers Award (MVP back in the
day) and led the Braves to a World Series victory over John
McGraw's NY Giants (the
famous $30,000 Snograss Muff in game 8). On the season
he batted .383 / .464 / .567 with 53 2B, 10 3B, 52 SB, and 136
R. For his career Speaker batted .380 or better and
incredible 5 times and his OBP dipped below .400 only three
times in 19 seasons as a regular.
Speaker, a left handed
thrower and batter, was naturally born right-handed but switched
when he was very young after breaking his right arm in a horse
accident. Forced to play left-handed, he |
became
so comfortable with it that he decided never to switch back. His
career was almost ruined before it started when, in college at the Fort
Worth Polytechnic Institute, he hurt his arm in a football accident so
badly the doctor recommended amputation as the treatment. He made
the right decision in refusing.
By the time 1915 was over, Speaker
had batted "just" .322, and as was common during this time period, was
enough to upset the Red Sox president, Joe Lannin. Lannin decided
to cut Speaker's salary by 40% but the center fielder refused and was
subsequently traded to Cleveland. The move worked, instead of a
pay cut down to $9,000 Speaker's new team paid him a record salary of
$40,000.
The trade was one of the worst in Red
Sox history. In return for Speaker, Lannin landed pitcher Sam
Jones, third basemen Fred Thomas, and cash considerations (50K).
Speaker would hit .354 / .444 /.520 over the next 11 seasons with the
Indians and became a very good Player/Manager from 1919-1926, winning a
World Series and finishing in the top half of the division in 5 of 8
seasons.
After retirement at the age of 40 in
1928, Speaker stayed close the game for only a few years before turning
his interests to the wholesale liquor business, and was even the
chairman of Cleveland's Boxing Commission for a time. But in 1947 he
returned to his roots, advising the Indians in various capacities until
his death 11 years later. Ty Cobb said that Speaker was the best
player he ever played against.
He was immortalized in the poem
"Lineup for Yesterday" by
Ogden Nash:
-
S is for Speaker
-
Swift center-field tender;
-
When the ball saw him coming
-
It yelled "I surrender."
In ATB VIII last season, Speaker was the #3 hitter
on the World Series bound Franklin Lakes Pillpoppers squad led by Justin
P. He batted .359 / .425 / .481, hit 47 doubles, and scored 104
times. He was drafted 48th overall (1st pick of 4th Round).
|
CAREER STATISTICS - TRIS SPEAKER
Year Ag Tm
G AB R H
2B 3B HR RBI SB CS BA
OBP SLG
1907 19 BOS 7 19
0 3 0 0 0
1 0 .158 .200 .158
1908 20 BOS 31 116 12
26 2 2 0 9
3 .224 .262 .276
1909 21 BOS 143 544 73 168
26 13 7 77 35
.309 .362 .443
1910 22 BOS 141 538 92 183
20 14 7 65 35
.340 .404 .468
1911 23 BOS 141 500 88 167
34 13 8 70 25
.334 .418 .502
1912 24 BOS 153 580 136 222
53 12
10 90 52
.383 .464 .567
1913 25 BOS 141 520 94 189
35 22 3 71 46
.363 .441 .533
1914 26 BOS 158 571
101 193
46 18 4
90 42 29 .338 .423 .503
1915 27 BOS 150 547 108 176
25 12 0 69 29 25 .322
.416 .411
1916 28 CLE 151 546 102
211
41 8
2 79 35 27 .386
.470
.502
1917 29 CLE 142 523 90 184
42 11 2 60 30
.352 .432 .486
1918 30 CLE 127 471 73 150
33 11 0
61 27 .318 .403 .435
1919 31 CLE 134 494 83 146
38 12 2 63 15
.296 .395 .433
1920 32 CLE 150 552 137 214
50 11 8
107 10 13 .388 .483 .562
1921 33 CLE 132 506 107 183
52 14 3
75 2 4 .362 .439 .538
1922 34 CLE 131 426 85 161
48 8 11
71 8 3 .378
.474 .606
1923 35 CLE 150 574 133 218
59 11 17
130 8 9 .380 .469 .610
1924 36 CLE 135 486 94 167
36 9 9 65 5
7 .344 .432 .510
1925 37 CLE 117 429 79 167
35 5 12 87 5
2 .389 .479 .578
1926 38 CLE 150 539 96 164
52 8 7 86 6
1 .304 .408 .469
1927 39 WSH 141 523 71 171
43 6 2 73 9
8 .327 .395 .444
1928 40 PHA 64 191 28
51 22 2 3 30
5 1 .267 .310 .450
CAREER 2789 10195 1882 3514 792
222 117 1529 432 129 .345 .428 .500 |
 |
9/3 - Remember the
Era!
Eras are by far the most important
concept to understand in order to put forth a successful ATB campaign.
Eras (not Earned Run Average, but DMB's name for the statistical average
of a given League and Year) put a player's story in context, and most
importantly from a gaming standpoint, are required to make a realistic
baseball simulation. From the DMB help sections:
It is not possible to play
realistic games among teams of different eras without adjusting for
these changing playing conditions. For example, without these
adjustments, a 1912 team would have almost no chance of beating a
1984 team because it would make two to three times as many errors.
Are the 1984 fielders really that much better? Of course not. They
just have the advantage of using modern gloves and playing on
artificial turf.
and
DMB uses eras to adjust for these
factors. In DMB:
-
A .280 hitter in 1968 (when
the league batting average was under .250) is a better hitter
than someone who hit .280 in 1930 (when the average player
batted .300).
-
A shortstop making 40 errors
in 1912 is a better fielder than a shortstop making 30 errors in
1993.
-
A starting pitcher completing
30% of his games in 1984 is more durable (relative to his peers)
than someone who completed 50% of his starts in 1920.
-
A DH-league pitcher with a
3.30 earned-run average is a better pitcher than someone with a
3.00 ERA in a non-DH league.
From our standpoint, it bears
repeating - eras have an impact on every aspect of the game:
Hitting, Pitching, and Fielding. Each of these need to be
taken into consideration when drafting.
DBM uses several required statistics
create "normalized" player records. DMB uses the league and year,
along with the core player stats, to create a "hidden" normalized stat
line. This normalized stat line is what is used to determine the
results. It is "hidden" from users, including commissioners, as it
is proprietary to DMB and perhaps more importantly, displaying it would
ruin a lot of the fun in playing the games out.
I am not going to go into era
adjustments for fielding since the About DMB
section tells you how to precisely calculate Fielding Error rates.
Instead I'll focus on batting and pitching. First thing's first,
the following statistics are required whenever I add a player to
the database:
Batting
AB, H, 2B, 3B, HR, HBP, IBB, SH, GDP,
SO, SB, CS
Pitching
BF, HR, HBP, IBB, IP, H, HR, HBP, BB,
SO
This is critical. Hopefully you
noticed that R, RBI, W, L, and even ERA are not part of the required
stats for DMB to generate the normalized player record. Instead,
it uses more sophisticated stats that can be gleamed from the ones
above, such as WHIP, K/BB, K/9, H/9, SLG, AVG, OBP, etc. This is
just to say ignore certain stats when determining which players to
draft.
Please note that in the end these
stats correlate exactly to what makes a player a good and don't be
concerned, for instnace, that ERA isn't a core statistic.
Said another way, if a pitcher strikes out a lot of batters, minimizes
his walks and hits against, and makes sure not to give up the long ball
- his ERA will be excellent.
Also note, in cases were some of
these statistics are not known, DMB uses a built
in equation to estimate them for us.
Now that we understand how DMB works,
it's time to take a look a some real life era data
This chart depicts the runs scoring
environment for the two main leagues in baseball history, the American
and National Leagues of course. There were 5 other leagues
throughout history, none lasted more than 10 years (most much less), and
the last of these was the Federal league in 1915.
Right now, as we know, we are in the
midst of a elevated run scoring environment, although it not as prolific
as what was experienced in both leagues during the early 1930's and in
the American League in the last 1930's; and of course, nowhere near the
levels of the late 1890s. The lowest runs scoring eras were around
1907-1909, 1917, and 1968.
And now the key and the only official
warning you'll get from me - several great players made a name
for themselves in these extreme eras. 1968 is home to Bob Gibson
(1.68 ERA) and Denny McLain (31 Wins); 1930 is home Bill Terry (.401
AVG), Hack Wilson (191 RBI); and the 1907-1909 period sports Three
Finger Brown (1.31 ERA) and Addie Joss (1.16 ERA). This is not to
say all or even some of these players will not perform, rather it is to
say don't expect those insanely low ERA's or high batting averages to
translate into our game, and do a little research comparing them to
their peers before drafting them. The goal, really, is to find
good batters in low offensive years, and good pitchers in high offensive
years. Two excellent, but crude tools to use are the
ERA+ and OPS+
leader boards found Baseball-Reference.com. I personally like
the math aspect, and download the historical "Lahman Database" found at
the Baseball Archive, and
perform some calculations on my own.
Finally, I will leave you with two
more points and two more charts.
-
I literally have no idea how DMB
values each season in terms of run scoring. I would imagine it
is much more robust than the chart I used above that simply depicts
runs per game, and they in all likelihood the DMB engine gets down
to the individual stat level - League Average SLG, OBP, AVG or
perhaps even HR Rates. But for all intents and purposes,
unless you have a lot of time on your hands AND are a complete
freak, you don't need to get down to this level of detail.
-
Don't forget parks. The era
is only part of the normalization process, and DMB also uses
proprietary park factors in the process
And the charts - the historical AVG,
OBP, SLG and historical WHIP, K/9, and HR/9 for each league.
8/30 -
Why the 1800s
Players Were Introduced to ATB
(taken from The New Bill James
Historical Abstract)
How the Game was Played (1890s)
Dirty. Very, very dirty. The tactics
of the 1880’s were aggressive; the tactics of the 1890s were violent.
The game of the 80s was crude; the game of the 90s was criminal. The
baseball of the 80s had ugly elements; the game of nineties was just
ugly.
Players spiked one another. A first
baseman would grab the belt of the base runner to hold him back a
half-second after the ball was hit. Players tripped one another as they
rounded the bases. Fights broke out more days than not. Players shoved
umpires, spat on them, and punched them. Fans hurled insults and beer
bottles at the players of opposing teams
The great team of the time, and the
team responsible for promoting this style of play, was the Baltimore
Orioles, the team of John McGraw, Hughie Jennings, and
Willie Keeler. Writing about them in the Ultimate Baseball Book,
Robert Creamer said that John McGraw “had a genius for making enemies.
He had been knocked down in spring training by a rival manager after
blocking a player on the basepaths. He did grab base runners’ belts to
slow them down as they passed, stood in their way deliberately to make
them run around him, stepped on their feet as he took throws at the
bag.” McGraw himself recalled a game in which “the other team had a
runner on first who started to steal second, but…spiked our first
basemen on the foot. Our man retaliated by trying to trip him. He got
away, but at second Heinie Reits tried to block him off while
Hughie…covered the bag to take the throw and tag him. The runner evaded
Reits and jumped feet first at Jennings to drive him away from the bag.
Jennings dodged the flying spikes and threw himself bodily at the
runner, knocking him flat. In the meantime, the batter hit our catcher
on the hands with his bat so he couldn’t throw, and our catcher trod on
the umpires feet with his spikes and shoved his big mitt in his face so
he couldn’t see the play.
Great fun, huh?
*****************
Honus Wagner was once asked
about his greatest trill in baseball. “Well, the greatest thrill I ever
got was one time a Giant batter hit a home run. As he ran past me I
said, ‘Nice hit’, and he said, ‘Go to hell’.”
Pause
Alright, Honus, why was that your
greatest thrill?
I’d been in the league for three
years,” said Honus. “And he was the first player to speak to me.”
*****************
In 1883 a Philadelphia zookeeper
named Jim Murray introduced a system of relaying scores almost instantly
all over the city of Brotherly Love, by means of carrier pigeons. Homing
pigeons would be released at the park with the up-to-date scores after
each half-inning, and the workers at the zoo would “knew how the inning
went before they went out in the field for the next one.” A few fans
from other parts of the city heard about this and wanted in on it, so
provisions were made for them, too. On some days as many as a half-dozen
birds would be released at the end of each frame.
*****************
...In a lot of ways, the baseball of
1876 was, in fact, extremely primitive. A ball was fair if it bounced in
fair territory, which effectively required the fielders to cover a
larger area. (Ross Barnes hit .429 in the first season of the
National League, 1876, by perfecting the “fair-foul bunt” – that is,
landing the ball in fair territory so that it would roll foul.)
8/27 - The DMB
Manager Profile
Draft Day is
just a few weeks away and it is probably time to go over the type of
decision each owner will need to make when constructing their lineups.
This can be a daunting task or simple one, depending on how much you
feel like manipulating the PC Manager who will actually be "playing" the
games. But keep in mind no matter how you fill out the lineup
sheets, the PC manager will ensure the basics are performed on your team
on a game by game basis. For example, they won't allow vacant
lineups, tired pitchers to throw under normal circumstances, or try to
steal with poorly rated players. However, the more work you put
into your lineup the more the PC Manager will
run the team to your liking.
There is a lineup
form that is to be filled out prior to the start of the season and
to communicate any changes during the season. What follows is an
explanation of how the form relates to the tools within Diamond Mind
Baseball.
Rosters
We will run simulations on a weekly
basis (15 games at a clip) and lineup changes are made once per week.
Rosters are 30 men deep to allow for back-up players to be readily
available to fill in during cases of multiple injuries. You can
draft any combination of batters and pitchers, as long as you have
enough if each to complete a basic lineup.
Rosters can be changed in three ways:
1 - Trades. Unlimited,
but Comish holds veto power in case of any funky business. Comish
has never had to use veto power in 8 ATB seasons.
2 - Free Agent Moves - 5 allowed on
the year
3 - DL Moves - Any player
injured is eligible to be placed on the DL, and owners are allowed to
replace any player on the DL with a Free Agent. These moves do not
count against the 5 Free Agent moves, and are unlimited.
Pitching Rotation
There are 6 roles to a rotation -
Starters, Spot Starters, Mopup, Long Relievers, Setup Relievers, and
Closers. The "About DMB" section of
this site goes into the game situations where and when each type of role
is used. What I want to outline now are the choices in terms of
number of pitchers that can be used in each role and where you can
select Left-handed or Right-handed pitchers. For instance, it is
important to note that you have the choice for LH/RH in both setup and
closer roles and I therefore suggest taking advantage of this on draft
day. It is probably too obvious to state, but the game engine will
try and force the appropriate righty on righty or lefty on lefty
pitcher/batter match-ups based upon how you complete the lineup form.
Here are screen shots of the various sections to be completed:

Lineups and Depth Charts
In addition to the option of using
unique lineups depending upon the handedness of the oppositions starting
pitcher, the game engine allows for extremely detailed depth
charts/bench options.

For each position you can name your
back-ups and designate a percentage of time you want them to start. You
can even do this based upon the handedness of the starting pitcher.
For example, you can have Don Mattingly back up the starting 1st Basemen
50% of time versus righties, and then also have Orlando Cepeda back up a
35% of the time versus lefties. Strict platoons and
defensive replacements to be used late in games are additional options.
The screen print to the above and
right depicts the fact you can also identify the order in which your
pinch hitters will be used.
Manager & Player Tendencies
Aside from lineup and rotation
construction, owners can also tell the PC manager what style of play is
preferred. From how often the team bunts, to how often pitch outs
are called, or what type of defensive alignment is preferred, owners
have extremely detailed control over many aspects of the game.
For the die hard's, similar controls
can be given to each player. You want Rickey Henderson to
steal but Ty Cobb not too? Go right ahead. You want Mariano
Rivera to use more pick off throws to first than Bruce Sutter?
Fine! The level of detail is entirely in each owners control.
Team
Player
The level of involvement in ATB is
entirely at the owners discretion. Owners who change their
lineups once a year (Mike S) have won the championship, and owners who
keep me on the phone till 11 PM at night making scores of last minute
changes (Sean) have won too. Just keep these
situations/requirements in mind as you are constructing your roster
during the draft.
Defense Matters -
August 24
It's been
mentioned in past seasons and I have tried to press home the point with
a few blurbs here and there during this pre-season, but a "study" was
done a few years back to help users understand how much defense truly
does matter in Diamond Mind leagues.
To understand
the study we should outline the basics first (and all of this and more
is located in the "About DMB" section).
Defense is broken down into three different ratings: Error Rates,
Range, and Arm Strength (for Catchers and Outfielders). A
defensive rating first lists the range of a player at a specific
position and then the error rate. For example, 1987 Ozzie Smith's
SS defensive rating is Ex / 40. This means he has "Excellent"
Range and his error rate is 40% of an average shortstop. This is
stellar, one of the best you will find in the game. The five
ranges are Poor (Pr), Fair (Fr), Average (Av), Very Good (Vg), and
Excellent (Ex).
Error rates
are self explanatory and not part of the study. Any value over 100
is worse than average, any value under is better than average. A
score 110, for example, means the player will yield 10% more errors than
average.
It is the
Range factor we are concerned with today. How exactly does this
impact run scoring? How much better is Ex over Vg or how much
worse is Pr than Av? The "study" ran 100 seasons for each change
in defensive ratings. 100 seasons were ran where the defensive ranges
for a team were set to Average. Then, 100 additional seasons were ran
each position was changed. For example,
the SS was bumped to Vg. Then another 100 bumping the shortstop up to Ex,
keeping everything else the same. This was repeated for every
position, changing only the range types of a particular position each
time. A summary of the results:
Well, it's a
lengthy summary, but what the above shows is as follows:
-
Catcher
ranges have no discernable effect on run scoring
-
Pitcher
ranges have very little effect on run scoring (836 to 843 Runs
Scored Spread)
-
Infielders
have a significant effect with the average Runs Scored spread
ranging from 818 to 858
-
Outfielders have a great effect, but slightly less so than
infielders. Spread of 823 R to 857 R
We need to
take a step back and realize what this means. Using Bill James
Pythagorean formula to determine "expected" wins based upon runs scored
and runs against, a completely average defensive team (838 RS and 838 RA
for example) can gain two wins in the standings by just improving their
Third Basemen's range to Ex. The difference between a poor third
basemen (Edgar Martinez) and a great one (Brooks Robinson) is even more
pronounced - a whopping 4.5 games.
Now think
about the effect of compiling a team with above average defense at most
positions and the possibilities for a playoff birth should begin to fill
your mind. Of course, defensive wizards tend to have a weak stick
and the lack of offense needs to be taken into consideration too.
One of the nice aspects of DMB is the ability to use defensive
replacements, allowing an owner to substitute their offensive star for a
defensive minded player late in the game.
We'll end on
the list of Excellent rated players in the database today.
Excellent Outfield and Catcher
arms...
If you
want to read up on the full study, please read
this post by the now famous "pearceg".
Greatest Seasons
of All Time Baseball - August 23
The history of the All Time Baseball
league goes back 9 seasons, and started in the year 2000 using a
software package that is no longer available today (Tony Larussa
Baseball 3). League formats have changed through the years - we've
had list drafts, live drafts, computer AI drafts as well as Free Form
teams (select any player, dupes allowed), Greatest Real Life Teams, and
the current version of the league that started with ATB VII.
Much like in the early years of MLB,
the early years of ATB have been unkind to data retention and reliable
stats have only been recorded only as far back as ATB IV. In prior years
we only know bits and pieces of various statistics, such as:
-
Billy Hamilton's 105 SB in ATB II
-
Anecdotal evidence that Jim
McCormick was the greatest pitcher of all time (think 30 wins and a
sub-2.00 ERA in ATB I). On a lighter note, later analysis
revealed that McCormick real life player record was incorrectly used
in ATB I. In 1884 He was traded from the Cleveland Blues
(19-22, 2.86 ERA) to the Cincinnati Outlaw Reds (21-3, 1.54 ERA) and
only his Reds stats were used as the source line.
Since the 3rd year of the league
however, player records have been retained in a more comprehensive
manner. We may not know opponents batting average for pitchers or a
players RC/27 score until more recent seasons, but we at least can
obtain a glimpse at some of the more impressive performances witnessed.
What follows are a handful of these
great performances - the 10 greatest seasons recorded in ATB history.
#10) 1991 Ricky Henderson,
ATB VIII (Van Nest Phighting Philbins):
.299 / .388 / .522, .909 OPS, 31 HR,
150 R, 112 RBI, 65 SB
New owner Jeff Burns took the ATB
world by surprise, storming his way to the best record in the league at
98-64. Henderson batted lead-off for the Phighting Philbins, and
Jeff had 1957 Mickey Mantle (.342 / .463 / .547) batting clean-up to
help Pad Henderson's runs scored totals. As a lead off hitter,
there is not much more to ask for - high on base percentage, 65 steals,
and enough pop to do plenty of damage when not leading off an inning.
#9) 1941 Ted Williams,
ATB III (Florham Park Slap Hitters)
.350 / .470 / .681, 1.156 OPS, 57 HR,
163 R, 193 RBI
If you like counting stats look no
further than Williams and his selection to the squad owned by the now
MIA Bruce Nalepka. Nalepka's one foray into ATB was successful,
compiling an 89-73 (.543 Wpct) record thanks in large part to his left
fielder. Williams set a record that stands to this day - compiling
a combined 356 Runs and RBI in a single season. No batter has
compiled as many as 320 before or since, and 193 RBI is another record
that hasn't been approached.
#8) 1995 Greg Maddux,
ATB VI (North Dakota No Scorers)
18-5, 2.42 ERA, 241 IP, 223 H, 53 BB,
165 K, 1.14 WHIP
Maddux was the runner up for the Cy
Young award this year but his 18-5 record was the best winning
percentage recorded by a starter that season. Sean Seeley's No
Scorers won the title this year thanks in part to Maddux prowess.
Perhaps most remarkable was the fact that Maddux was able to do so well
in 1944 Forbes Field, a park that yielded 12% more singles, 25% more
doubles, and 30% more triples than average.
#7) 1932 Babe Ruth,
ATB V (1932 Yankees)
.328 / .518 / .707, 1.226 OPS, 58 HR,
124 R, 137 RBI
ATB V was a season in which owners
selected historical teams as opposed to historical players. Ruth
was a shining star on one of the worst teams in the league, the 1932
Yankees, and recorded the highest OBP in the history of the ATB while
smacking almost 60 home runs and keeping is batting average above .325.
#6) 2004 Randy Johnson,
ATB VII (Franklin Lakes Pillpoppers)
21-4, 1.98 ERA, 237 IP, 183 H, 73 BB,
193 K, 1.08 WHIP
For the first time ATB went to a live
draft and Justin Petronzi's Pillpoppers were a wrecking crew throughout
the regular season, compiling a stellar 108 wins, a mark that was only
duplicated in the very early versions of ATB leagues. As #1
starter and Cy Young Award winner, Johnson was virtually un-hittable all
season and his 1.98 ERA remains the current record. The only mark
against Johnson, and one that prevents a higher ranking, was his WHIP
which a 1.08 doesn't quite match up against some other great pitcher
seasons.
Also of note - this was the first
year in which the 2004 version of Randy Johnson was used. While
his real life 16-14 W-L record is no great feat, keep in mind in an
astounding 10 of these losses Johnson gave up 3 runs or less. And 7 of
these were 2 runs or less.
#5) 2000 Pedro Martinez,
ATB VI (Phoenix Coyotes - PC Led)
21-8, 2.31 ERA, 253 IP, 197 H, 54 BB,
270 K, 0.99 WHIP
ATB VI, among most other seasons,
contained a handful of PC led teams. This squad was one of the
more successful ones, narrowly missing the playoffs despite a pretty
good 89-73 record. Martinez, the star of the team and eventual Cy
Young award winner, is one of the few starting pitchers in ATB history
to amass more strikeouts that innings pitched. This year his K/BB
ratio was an incredible 5-1 and one wonders how he lost 8 games.
#4) 1920 Babe Ruth,
ATB VIII (St. Louis Perfectos - PC Led)
.324 / .453 / .744, 1.197 OPS, 63 HR,
144 R, 159 RBI
In the first true monster offensive
season, Ruth climbed into the pantheon of rare .700 sluggers (35 all
time in real life) thanks to the 111 extra base hits he amassed (38 2B,
10 3B, 63 HR). His 159 RBI are 4th all time and 144 R are 5th.
One oft debated item is which Ruth year is best - 1920 or 1921? In
the earlier year Ruth had his best 'rate stat season' (.376 / .533 /
.849) but the later year was the one were he recorded 177 R and 171 RBI.
In evaluating players, Diamond Mind focuses on statistics the batter can
control and lets the quality of team take care of how many runners are
driven in and scored. Ruth was also named the MVP of ATB VIII.
#3) 1927 Lou Gehrig,
ATB V (1927 Yankees)
.331 / .453 / .771, 1.224 OPS, 55 HR,
151 R, 162 RBI
If you recall, ATB V was the season
in which historical teams were selected. TJ's choice for the 1927
Yankees was really a no-brainer, even if he did lose in the Division
Series to the eventual World Champion 1941 Brooklyn Dodgers. The
'27 Yanks featured "murderers row" of course, and Gehrig was second in
the MVP voting behind a teammate and and a season yet to be mentioned in
this space. His season totals for OPS, R, and RBI are each 3rd
best of all time
#2) 2000 Pedro Martinez,
ATB VII (Mendham Maulers)
17-4, 2.29 ERA, 232 IP, 153 H, 50 BB,
238 K, 0.87 WHIP
The best individual pitching
performance of all time was another 2000 Pedro Martinez campaign, this
time he recorded a most impressive WHIP score below 0.90 while
continuing to strike out more than a better per inning. Martinez
lost only 4 times all season long and his win total would no doubt be
higher had Mike S's squad been able to win more than 81 games. In
what can only be considered a travesty (as bad a things can get in
Fantasy Sports) Martinez, with the best performance ever, was
maligned in the Cy Young award voting finishing second to Randy Johnson
(#6 all time above). Yes Johnson had more wins and a better ERA,
but it is clear Martinez was the more dominant pitcher:
Martinez- 2.04 RCERA, 9.2 K/9, 5.9 H/9,
4.8 K/BB
Johnson - 2.52 RCERA, 7.4 K/9, 7.0 H/9,
2.9 K/BB
It is also clear the voter (the
Commissioner) only took into account Wins and ERA and for that he
wholeheartedly apologizes.
#1) 1927 Babe Ruth,
ATB V (1927 Yankees)
.327 / .487 /.837, 1.323 OPS, 79 HR,
153 R, 165 RBI
Another ATB V player makes to the top
10 list and Ruth's fantasy accomplishments even exceeded his actual
"bigger than life" status enjoyed with the New York Yankees. Ruth
belted an unheard of 79 HR, a mark that hasn't been challenged before or
since (Mark McGwire is second all time with 64 in ATB VI). He also
doubled 35 times and is one of just 4 players to reach over 300 R+RBI's
in a season.
'27 Ruth and '27 Lou Gehrig (#3 on
this list) make the best 3-4 combination in ATB history - with 134 HR,
304 R, 327 RBI between them. Unfortunately for TJ only one other
starter had an OPS over .800 and three were at .700 or below, so the
1927 Yankees were ousted in the 1st round of the playoffs.
'27 Ruth also holds the ATB record for SLG and OPS, and the latter is
almost 100 points better than 2nd place - the '32 version of Ruth.
Honorable Mention
It is not easy for a reliever to
crack the top 10 seasons of all time, but Mariano Rivera of the West
Village Tank Toppers in ATB IV almost did so. In the best relief
pitching season in ATB history, Rivera compiled a 1.06 ERA and 29 Saves,
while walking 12 and striking out 45 in 68 innings of work. His
WHIP was just 0.84.
PC Mock Draft -
August 21
I thought it might be interesting to
run a PC controlled mock draft, this might be especially useful for some
of the newcomers. What you need to know:
1) - Generally, the PC does
not draft as well as a human. So, interpret these results as rough
guidelines as opposed gospel. Some known issues:
- They do not always draft at least 2 catchers
- They have an unnatural affinity for dead ball era pitchers with 400 or
more IP's.
- They underrate the value of relief pitching
- But they do a much better job than humans at evaluating defense which
is very important (and take note!)
2) - The PC can only choose
players in the database. This means they can only choose players
human owners have selected in previous ATB seasons. I only say
this to make sure it is understood that any player throughout
history is available, not just those drafted here. (I also added
some of the 2006 players I thought folks would draft).
3) - 16 PC teams drafted, each
using a DH.
On to the results. Below are a
few charts depicting the top players picked at each position. And
you can view the round by round results here.
FIRST BASE
SECOND BASE
THIRD BASE
SHORTSTOP
LEFT FIELD
CENTER FIELD
RIGHT FIELD
CATCHER
STARTING
PITCHERS
RELIEF PITCHERS

In the coming weeks up to the draft I
hope to provide more "for fun" information to keep us going while we
pass the long 3 weeks. I'll leave with a great quote from the
immortal Ty Cobb...
“Baseball is a red-blooded sport for red-blooded men. It's no pink
tea, and mollycoddles had better stay out. It's a struggle for
supremacy, a survival of the fittest."
|

