
This is a shift in demand graph
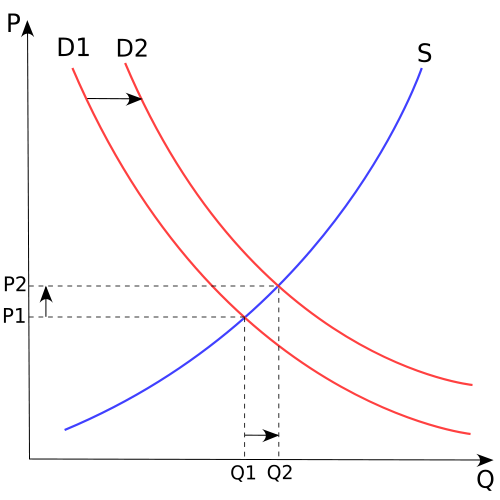 This graph shows when a shift in equilibrium occurs. Normally a shift in demand causes a price increase and an increase of quanity.
This is a graph of a shift along the demand curve.


This is a shift in demand graph
This graph shows when a shift in equilibrium occurs. Normally a shift in demand causes a price increase and an increase of quanity.
This is a graph of a shift along the demand curve.

A shift along the demand curve is a result of a change in the price of the quanity demanded. Any point or shift along the curve is still in equilibrium. Any point under the curve is inefficient, and any point outside the curve is unattainable.
This is a graph on double shifts
A double shift occurs when both curves of supply and demand move in a direction. This results in higher prices and lower quanity supplied and demanded,