Here's a place to track whatever ratings and viewership information
is available for Power Rangers on Nickelodeon.
Ratings info derived from Son of the Bronx and ShowBuzz Daily.
DEFINITIONS
RATING: Pct. of all households. SHARE: Pct. of households using TV
KIDS 6-11: One ratings point represents 247,600 viewers in that age group.
POWER RANGERS DINO SUPER CHARGE
Premiere weekends
(Total viewers - in millions)
(Number in red is series high)
(Number in grey-shaded box is Saturday series low) |
| Saturday Noon premiere | Sunday 8 a.m. encore |
| Episode 1 - "When Evil Stirs" |
| Jan. 30, 2016 - 1.339 | Jan. 31 - 0.915 |
| Episode 2 - "Forgive and Forget" |
| Feb. 6 - 1.197 | Feb. 7 - 0.913 |
| Episode 3 - "Nightmare in Amber Beach" |
| Feb. 13 - 1.365 | Feb. 14 - 1.009 |
| Episode 4 - "A Date With Danger" |
| Feb. 20 - 1.191 | Feb. 21 - 0.791 |
| Episode 5 - "Roar of the Red Ranger" |
| Feb. 27 - 1.198 | Feb. 28 - 0.901 |
| Episode 6 - "Forged Under Fire" |
| March 5 - 1.757 | March 6 - 0.816 |
| Episode 7 - "Home Run Koda" |
| March 19 - 1.497 | March 20 - N/A |
| Episode 8 - "Riches and Rags" |
| March 19 - 1.375 | March 20 - N/A |
| 20-WEEK SUMMER HIATUS GOES HERE |
| Episode 9 - "Besties 4Eva!" |
| Aug. 20 - 1.230 | Aug. 27 - 0.751 |
| Episode 10 - "Gone Fishin'" |
| Aug. 27 - 1.444 | Aug. 28 - 0.872 |
| Episode 11 - "Love at First Fight" |
| Sep. 3 - 1.417 | Sep. 4 - 0.840 |
| Episode 12 - "Catching Some Rays" |
| Sep. 10 - 1.403 | Sep. 11 - 0.987 |
| SEP. 17 PRE-EMPTED FOR WORLDWIDE DAY OF PLAY |
| Episode 13 - "Recipe For Disaster" |
| Sep. 24 - 1.413 | Sep. 25 - 0.899 |
| Episode 14 - "Silver Secret" |
| Oct. 1 - 1.615 | Oct. 2 - 0.817 |
| Episode 21 - "Trick or Trial" (Halloween ep) |
| Oct. 8 - 1.334 | Oct. 9 - 0.775 |
| Episode 15 - "Wings of Danger" |
| Oct. 15 - 1.056 | Oct. 16 - 0.912 |
| Episode 16 - "Freaky Fightday" |
| Oct. 22 - 1.341 | Oct. 23 - 0.799 |
| Episode 17 - "Worgworld" |
| Oct. 29 - 1.508 | Oct. 30 - no encore |
| Episode 18 - "The Rangers Rock!" |
| Nov. 5 - 1.381 | Nov. 6 - 1.172 |
| Episode 19 - "Edge of Extinction" |
| Nov. 12 - 1.417 | Nov. 13 - 0.918 |
| Episode 20 - "End of Extinction" |
| Nov. 19 - 1.543 | Nov. 20 - 0.847 |
| Episode 22 - "Here Comes Heximas" (Christmas ep) |
| Dec. 10 - 1.692 | Oct. 9 - 1.005 |
| Saturday averages | Sunday averages |
| DSC only: 1.396 million | DSC only: 892,000 |
DSC pre-hiatus: 1.365 million
DSC post-hiatus: 1.414 mil | DSC pre-hiatus: 891,000
DSC post-hiatus: 892,000 |
| All of DC: 1.402 million | All of DC: 872,000 |
 (Updated: 1/12/2017) The first part of the new-year catchup is getting the PRDSC numbers finalized and a new season-by-season chart down below. The biggest observation for this update is .... (drum roll) .... for the first time since PR moved to Nickelodeon, there was NO POST-HIATUS EROSION! DSC also almost duplicated PRSM's feat of having a higher average viewership than its non-Super counterpart, but I think the uniqueness of PRSM (past powers, all those keys, a sprinkling of guest Rangers) was in play on that. The post-hiatus increase even came with one of the October episodes being the 2nd-LEAST watched premiere episode in the six years PR has been on Nick. (Updated: 1/12/2017) The first part of the new-year catchup is getting the PRDSC numbers finalized and a new season-by-season chart down below. The biggest observation for this update is .... (drum roll) .... for the first time since PR moved to Nickelodeon, there was NO POST-HIATUS EROSION! DSC also almost duplicated PRSM's feat of having a higher average viewership than its non-Super counterpart, but I think the uniqueness of PRSM (past powers, all those keys, a sprinkling of guest Rangers) was in play on that. The post-hiatus increase even came with one of the October episodes being the 2nd-LEAST watched premiere episode in the six years PR has been on Nick.
There's no denying that one of the biggest factors in what weeks do well and which ones don't is the simple reality of having an episode of Spongebob (new or rerun) in the 11:30 a.m. slot. I'm not going to crunch Sponge vs. non-Sponge numbers but trust me, I've noticed a decided correlation.
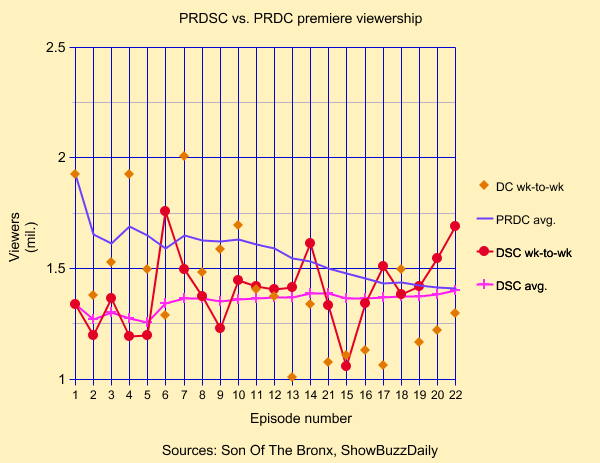
The 2016 graph focuses on how DSC does as compared to the Dino Charge season of 2015. The numbers across the bottom are out of order because the Halloween episode has a production number of 21, even though it's shown between 14 & 15 in October.
Here's the 10 most-watched and 10 least-watched new episodes since PR moved to Nick. Sadly, we have three PRDC episodes out of 14 already on the right-hand side of this chart:
MOST- AND LEAST-VIEWED NEW EPISODES
ON NICKELODEON
(Total viewers - in millions) |
| TOP TEN | BOTTOM TEN |
 | May 14, 2011
Samurai - ep 13
"The Blue & the Gold"
3.718 | Oct. 3, 2015
Dino Charge - ep 13
"Sync or Swim"
1.008 |
 | June 4, 2011
Samurai - ep 16
"Boxed In"
3.275 | Oct. 15, 2016
Dino Super Charge - ep 15
"Wings of Danger"
1.056 |
 | April 30, 2011
Samurai - ep 11
"Unexpected Arrival"
3.184 | Nov. 14, 2015
Dino Charge - ep 17
"World Famous
(in New Zealand)"
1.060 |
 | May 21, 2011
Samurai - ep 14
"Team Spirit"
3.151 | Oct. 17, 2015
Dino Charge - ep 21
"Ghostest With the Mostest"
1.074 |
 | May 28, 2011
Samurai - ep 15
"The Tengen Gate"
3.123 | Nov. 8, 2014
Super Megaforce - ep 18
"Emperor Mavro"
1.101 |
 | Feb. 13, 2011
Samurai - ep 2
"Deal With a Nighlok"
3.115 | Oct. 24, 2015
Dino Charge - ep 15
"Rise of a Ranger"
1.105 |
 | March 6, 2011
Samurai - ep 5
"A Fish Out of Water"
2.986 | Sept. 13, 2014
Super Megaforce - ep 11
"Love is in the Air"
1.117 |
 | May 7, 2011
Samurai - ep 12
"Room For One More"
2.919 | Nov. 7, 2015
Dino Charge - ep 16
"No Matter How You Slice It"
1.130 |
 | Feb. 20, 2011
Samurai - ep 3
"Day Off"
2.890 | Nov. 28, 2015
Dino Charge - ep 19
"Wishing For a Hero"
1.165 |
 | Feb. 27, 2011
Samurai - ep 4
"Sticks and Stones"
2.859 | Feb. 20, 2016
Dino Super Charge - ep 4
"A Date With Danger"
1.191 |
I've added the premieres-only audience averages here so I don't have to keep refiguring them. These show how toxic the massive summer hiatus has been each year to viewership. Look at how the average drops each time the new episodes resume in the fall. (Percentage of each year's erosion in red)
PR ON NICK
(Total viewership averages for new episodes)
Feb-Jun 2011 (PRS-1): 2.936 million viewers
Oct-Dec 2011 (PRS-2): 2.159 million (-26.5%)
Feb-May 2012 (PRSS-1): 2.034 million viewers
Oct-Dec 2012 (PRSS-2): 1.675 million (-17.6%)
Feb-Apr 2013 (PRM-1): 1.690 million viewers
Sep-Dec 2013 (PRM-2): 1.445 million (-14.5%)
Feb-Apr 2014 (PRSM-1): 1.867 million viewers
Sep-Nov 2014 (PRSM-2): 1.474 million (-21.0%)
Feb-Apr 2015 (PRDC-1): 1.650 million viewers
Aug-Dec 2015 (PRDC-2): 1.282 million (-22.3%)
Feb-Mar 2016 (PRDSC-1): 1.365 million viewers
Aug-Dec 2016 (PRDSC-2): 1.414 million (+3.6%!!!!)
SEASON-BY-SEASON VIEWERSHIP STATS
(2 eps of PRSS not available) |
| Year | Season | Eps | Total viewers | Average |
| 2011 | Samurai | 23 | 62.083 million | 2.699 million |
| 2012 | Super Samurai | 20 | 37.454 million | 1.873 million |
| 2013 | Megaforce | 22 | 34.000 million | 1.545 million |
| 2014 | Super Megaforce | 20 | 32.622 million | 1.631 million |
| 2015 | Dino Charge | 22 | 30.977 million | 1.408 million |
| 2016 | Dino Super Charge | 22 | 30.713 million | 1.396 million |
| GRAND TOTAL | 129 | 227.849 million | 1.766 million |
Here is the archive of previous series and ratings info. For reference's sake, if nothing else:
VORTEXX ON CW
(PRLG average: 0.67 rating / 3.67 share)
ABC KIDS
(PRWF average: 1.38 rating / 6.46 share)
(PRNS average: 1.42 / 6.86)
(PRDT average: 0.93 / 4.78)
(PRSPD average: 0.99 / 4.89)
(PRMF average: 0.96 / 4.64)
(PROO average: 0.70 / 3.55)
(PRJF average: 0.60 / 3.07)
(PRRPM average: 0.53 / 2.82)
(MMv2 average: 0.47 / 2.26)
NICKELODEON
(Saturdays)
(PRSS average: 2.33 / 11.50)
(PRS average: 3.10 / 14.46)
TOON DISNEY
(Saturday mornings)
(PRMF average: 0.45 / 1.81)
(PROO average: 0.54 / 2.42)
(PRJF average: 0.56 / 2.97)
ABC FAMILY
(Saturday mornings)
(PRWF average: 0.95 rating / 4.67 share)
(PRNS average: 1.17 rating / 5.86 share)
(PRDT average: 1.05 of 11 reported)
(PRSPD average: 0.71 rating / 3.33 share)
(SPD new eps only: 0.75 / 3.50)
|
