
 This part deals about the ALSEP, this set of measuring devices that the astronauts would have taken with them, and which would allow to make various experiments on the moon and get scientific data from it. Link to the NASA document describing the ALSEP The goal of this part is to show that these experiments were not as serious as it seems. |
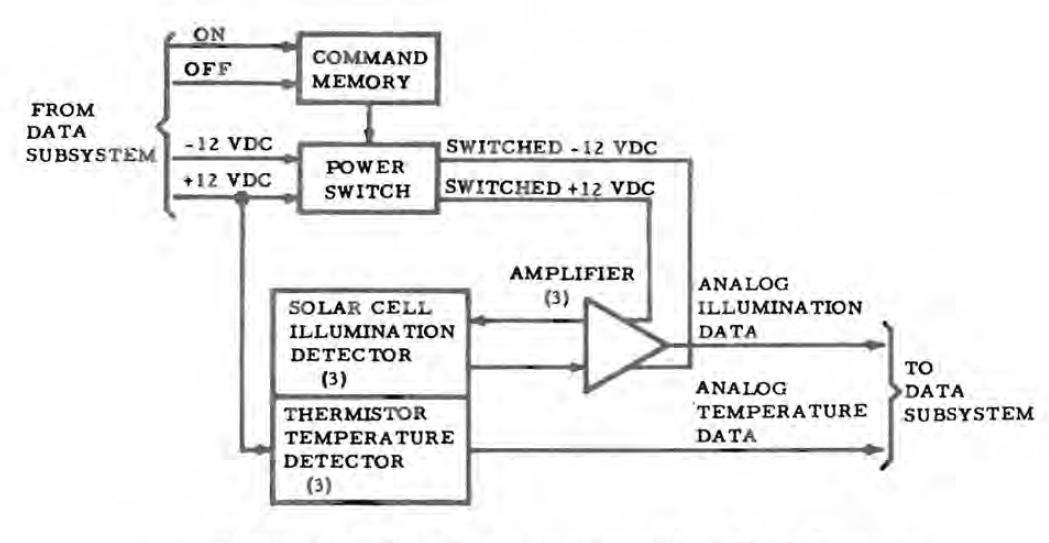
 This is the simplified block diagram of the ALSEP. We are going to see more in detail parts of it. |
 This is supposed to be the schema of the dust detector of the ALSEP. |
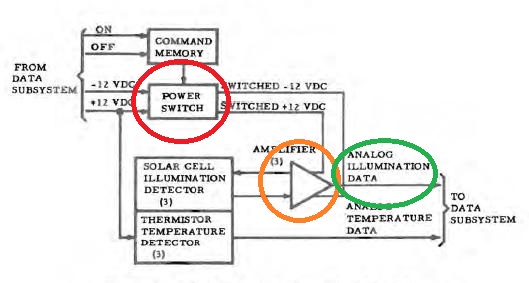 A command allows to activate or disactivate a power switch which allows to power on or off an amplifier of the illumination data. But why not simply ignore the illumination data when it is not desired? |
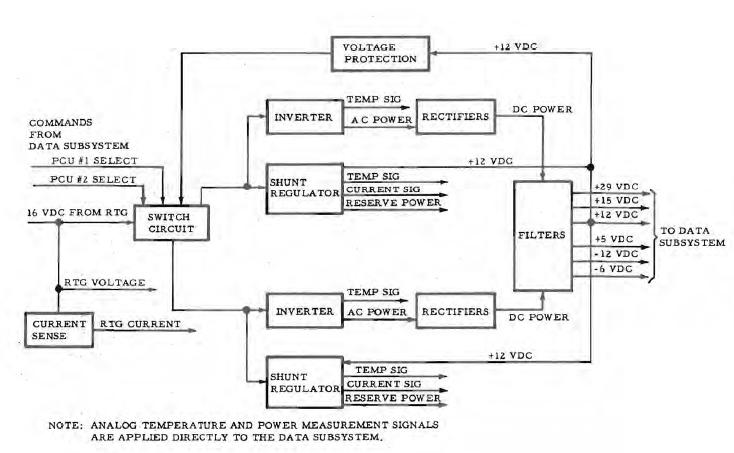 This is the block diagram of the EPS power generation function. |
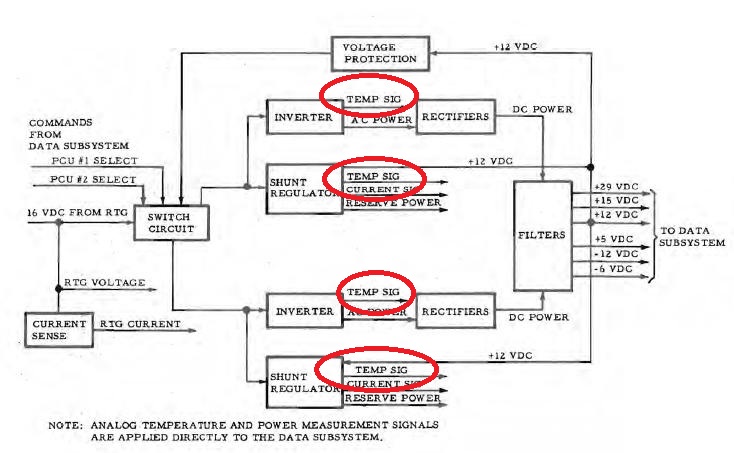 What I wonder about is how an inverter or a shunt regulator can generate a temperature signal (circled in red). |
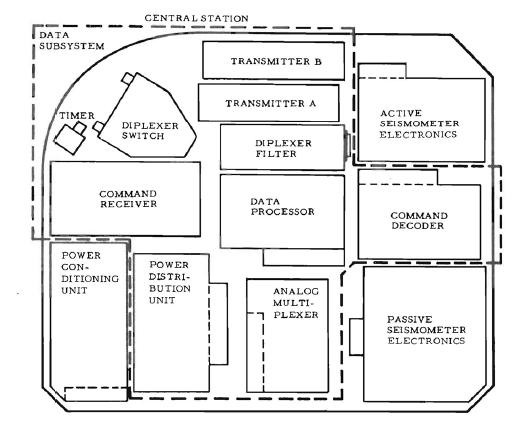 This shows the location of components of the Data subsystem. |
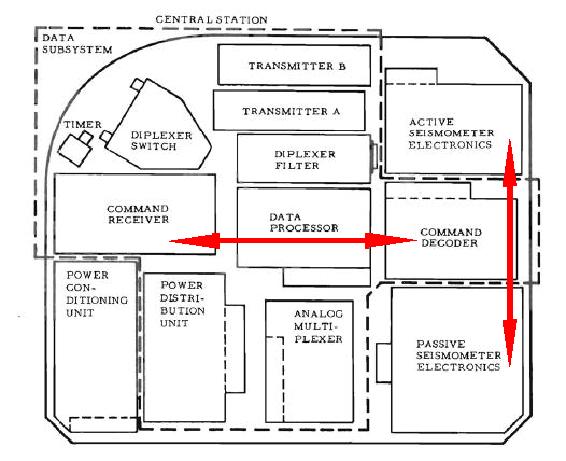 Normally the components should be located in a logical way, which means that the components which are related should be close to each other. Yet, the command decoder which follows the command receiver is separated by the data processor which is not directly related to the command reception. Then the active and passive seismometer electronics blocks, which both are acquisition devices, are separated by the command decoder, which puts the active seismometer electronics block farther from the analog multiplexer that, like the passive seismometer electronics block, it is also connected to. |
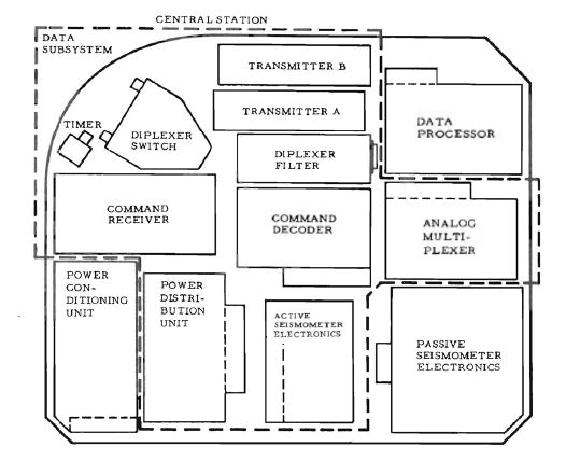 On this corrected diagram, I show a more logical disposition of blocks in the central station. |
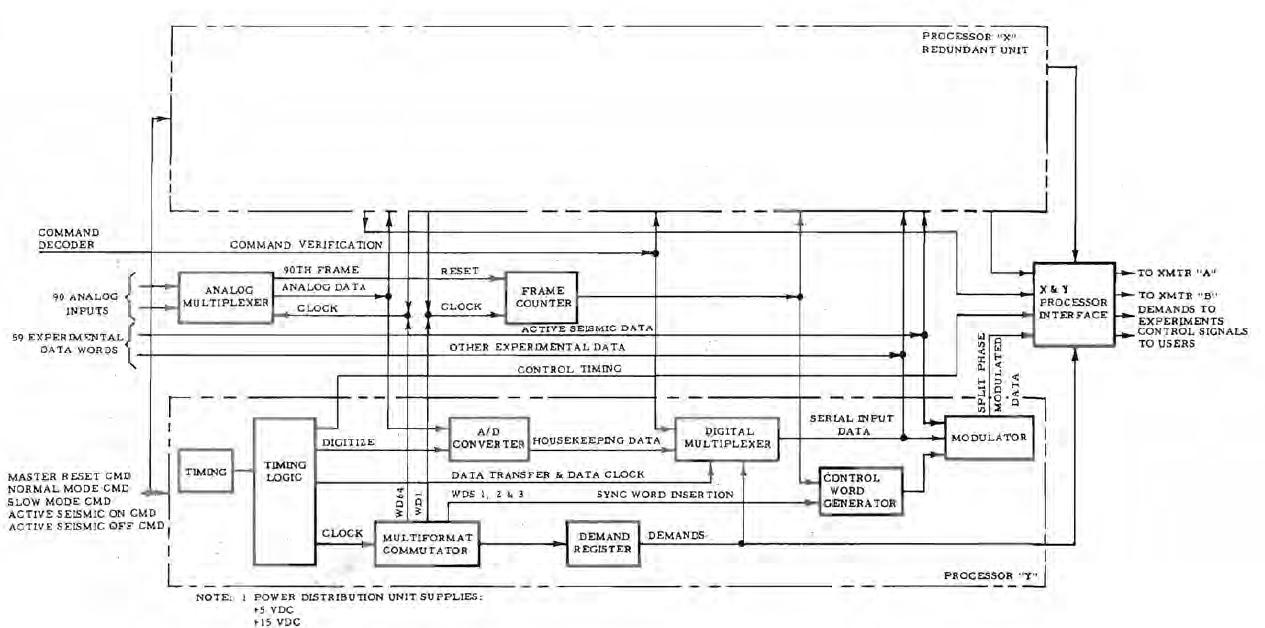
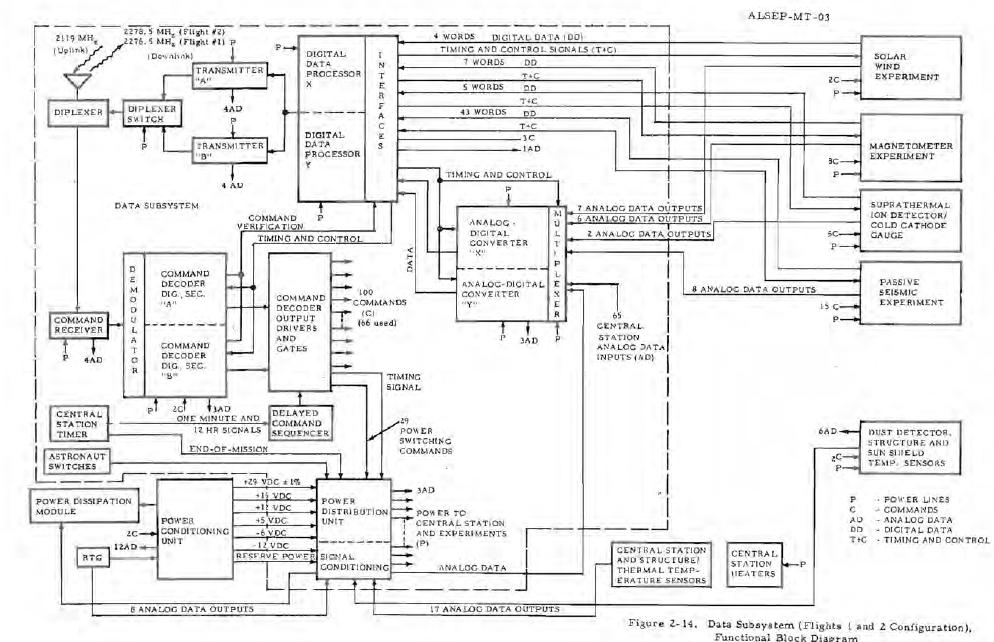 This is the functional block diagram of the Data Subsystem. |
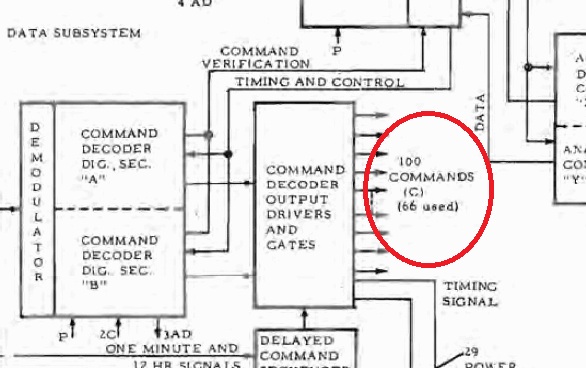 The command decoder can output up to 100 commands, of which 66 are effectively used. Yet, in order to encode 66 commands, 7 bits are needed, and with 7 bits it is possible to encode up to 128 values. So, why restrict to 100 the number of possible commands? They give the following explanation in the documentation of the ALSEP: "The command decoder is capable of accepting 128 different command messages and is designed to provide 100 commands to ALSEP users. All command code numbers except the following are available to the users: 0, 1, 2, 4, 8, 14, 16. 22,24,32,29,41,49,63, 64, 78, 86, 88, 95,103,105, 111, 113,119, 123, 125. 126, 127." But, why are some numbers not possible to use for the command? These forbidden numbers are not even consecutive! If it had really been necessary to reserve commands for a special use, these commands should at least have been consecutive! They also say this in the documentation: "Provisions have been incorporated in the command decoder to accommodate a maximum of 114 discrete commands which have been allotted as follows: a. Experiments 62 b. Power distribution 29 c. Power conditioning unit 2 d. Data processor 5 e. Command decoder 2 f. Available for test purposes 14" But why would the command decoder itself need command numbers for itself? The function of the command decoder is to decode commands, it has no use of commands for itself! |
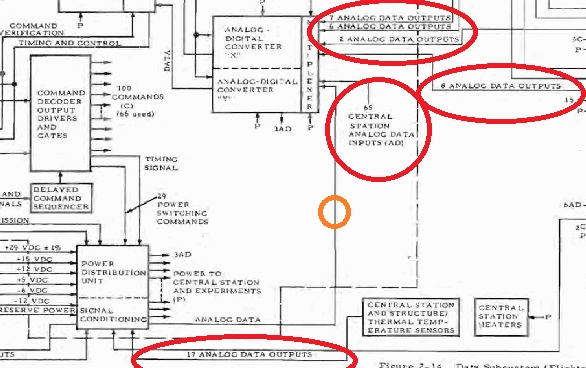 If we count the analog data outputs coming into the analog multiplexer, we obtain: 76+2+8+17+65=105. (There are 17 outputs, circled in orange, coming from the central station which go through the signal conditioning block) |
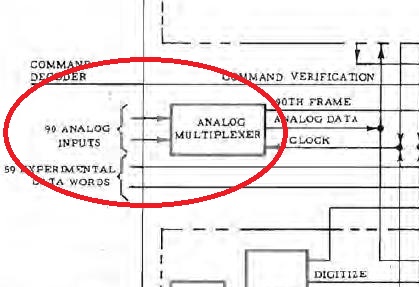 Yet, in the diagram of the Data Subsystem processor, only 90 analog outputs are indicated coming into the analog multiplexer. What has become with the 15 other ones? |
 The acquisition devices receive numeric information from the central station; that means that they have a capability of decoding this numeric information to execute the information it contains. But, if the devices have intelligence to decode numeric information, they could also have intelligence to encode numeric information. That means that they could multiplex their analog data, convert it to digital, and serialize it into a numeric message they could send upon request to the central station. What are the benefits of sending the data in numeric form? First it would allow to reduce the wiring, for the numeric message could be sent on a single wire instead of having as many wires as there are data to acquire from the device, and, given the length of the connecting cable, the less there are wires and the better; eventually the wire for sending the numeric information could be duplicated for redundancy. Then it would avoid the degradation of the data which is sent to the central station; sending analog data through a so long cable has much chance to result in signal loss which could affect the analog data and modify it; this could be avoided by sending numeric data instead. |
 This is the functional block diagram of the Data Subsystem command decoder. |
 First there is a bit of the shift register (circled in green) which comes into the parity comparator (circled in blue), which is normal, but the serialized NRZ train of bits (circled in red) also goes into the parity comparator, and this is much less normal. Normally it is a parity bit of the shift register which should be compared with a bit computed from the other bits of the shift register. The NRZ signal does not specifically represents a parity, it represents a fast succession of bits. |
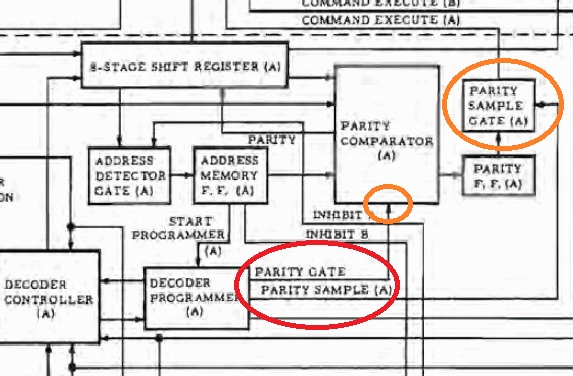 Then the decoder programmer generates two signals, parity gate, and parity sample, which allow to validate the parity comparison. But these two signals are uselessly redundant; any of them would be enough to validate this comparison. |
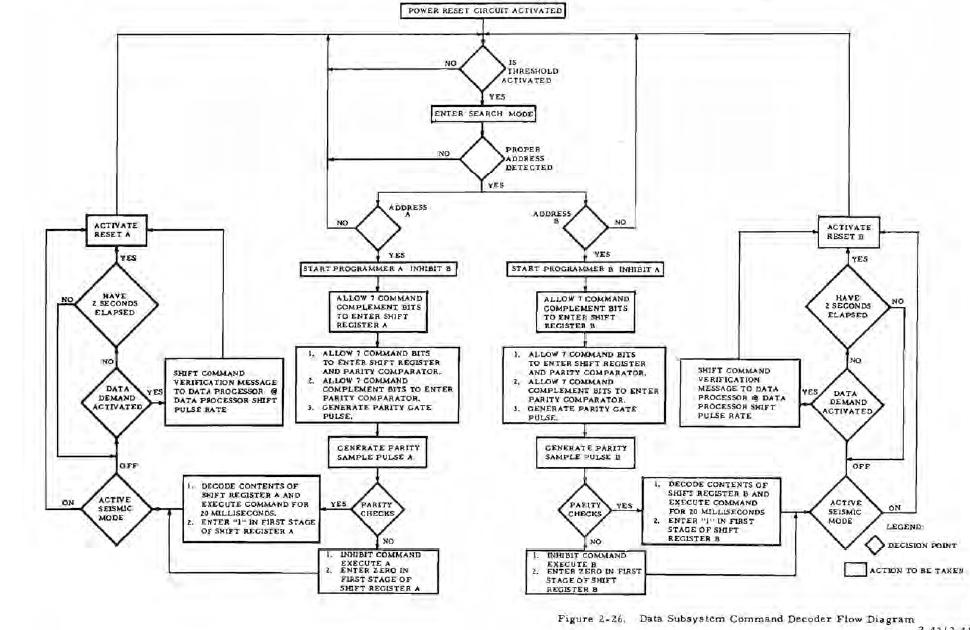 This is the flow diagram of the Data Subsystem command decoder. |
 This diagram first makes a detection of the address of the command to see if it is proper, which means that it must be either an Address A or an Address B; if it is none of the two, it is rejected, and if it is one of the two, it goes both into the Address A processing and the Address B processing; the Address A processing tests if it is an Address A, processes it if it is, and rejects it if it is not; likewise the Address B processing tests if it is an Address B, processes it if it is, and rejects it if it is not. In fact, this is uselessly complicated. |
 Indeed, it could be simplified by making this correction: It is first tested to see if it is an Address A, is processed as an Address A if it is, and, if it is not, it is then tested to see if it is an address B, is processed as an address B if it is, and is rejected if it is not. But why make it simple when you can make it more complicated, like it is used to say? |
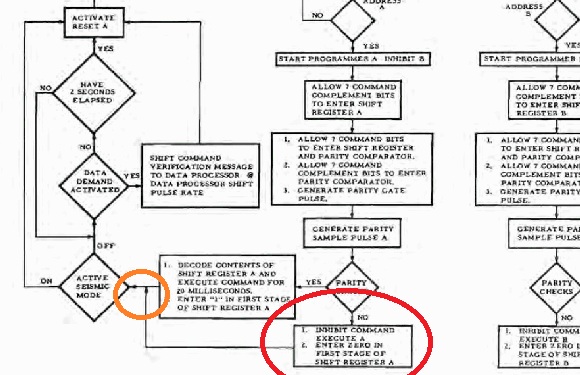 Then, if the parity checks fails, the command is not executed, and marked as failed (by the block circled in red). But it is still processed for command verification message to the data processor. Note that there has been no failure in the execution of the command, since the system could not d�termine what command to execute. |
 Normally, if the command has been detected as not valid for parity failure, it would be more logical that it would bypass the command verification message to the data processor; only commands which have been either successfully or unsuccessfully executed should be submitted for verification by the data processor, not unknown unprocessed commands. |
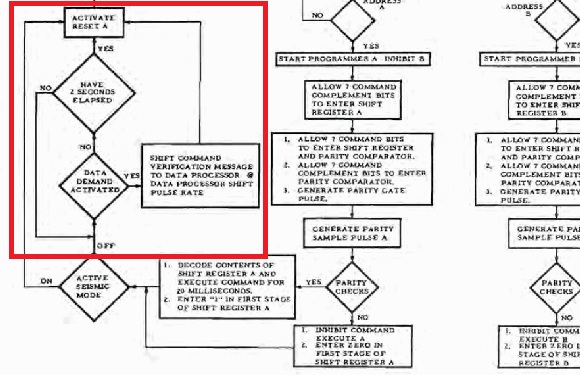 If the Data demand is not detected activated after two seconds, the command verification message is canceled. Of course, a command should not block the processing of another incoming command, but why not simply wait till another command requests to be processed before canceling the command verification message? Suppose the next command arrives one minute later (or one hour); the command verification message is canceled only after two seconds when it would have been possible to wait for one minute since no command arrived before one minute? It is completely absurd! The time-out of two seconds should only be applied if another command is waiting; otherwise the loop could wait till another command arrives. Of course, if the next command takes too long to arrive, it might be desirable to use a time-out, but longer than two seconds. |
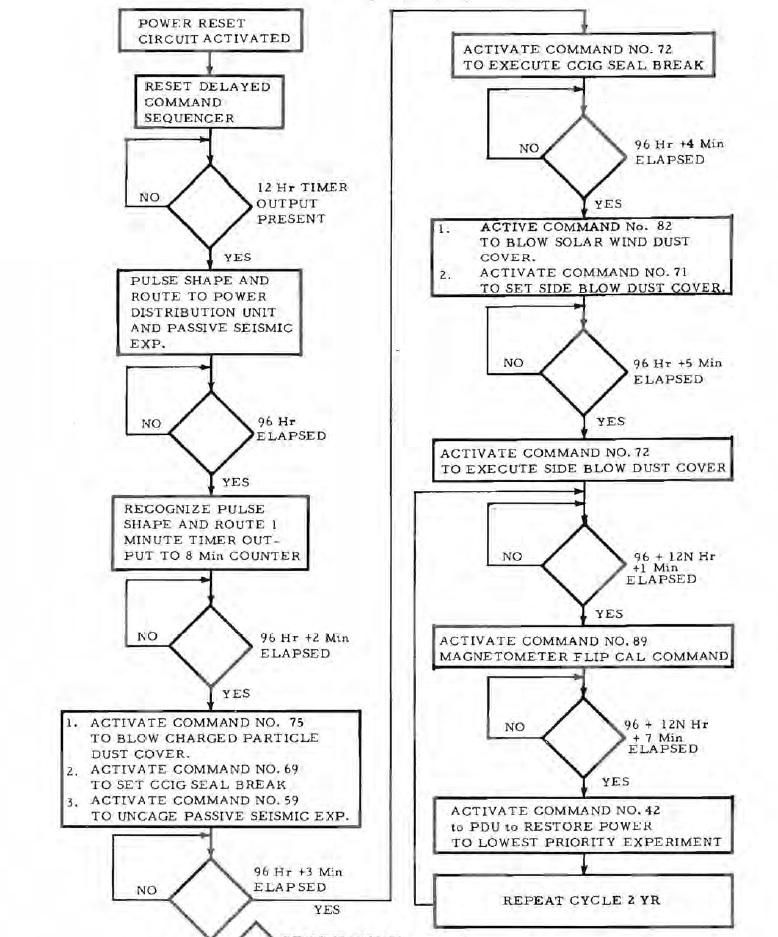 This the functional flow chart of the Data subsystem delayed command sequence. This sequence allows to periodically make maintenance commands (on a cycle of two years) The first maintenance command is applied 96 hours after the maintenance period occurs, and then sequences of commands are successively executed after consecutive pauses of one minute. But this is completely absurd, all the maintenance commands could perfectly be executed without separating them by pauses Making all these delays does not make the least sense, it is a totally useless complication! But, like it has already been said, why make it simple when you can make it more complicated! |
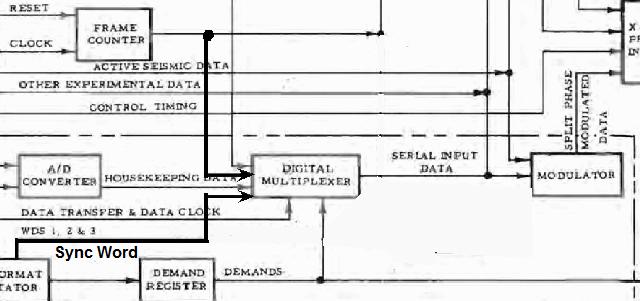
 This is the functional block diagram of the data processor of the Data subsystem. First, I must give some explanations to make some anomalies more clear. |
When several digital informations must be transmitted into a numeric message, it works this way: - A digital multiplexer successively selects the digital information to transmit. - Each time a digital information has been selected by the multiplexer, this one is serialized, by using what is called a shift register, in order to create a train of bits. - Then the train of bits goes into a modulator, in which it modulates a high (and even ultra high) frequency carrier which allows to transmit it through space. |
When several analog data are to be transmitted, and that each analog data must be transmitted in numeric form in a message which also contains a frame number and a marker code, each analog data is successively selected by an analog multiplexer, then converted to digital by an A/D converter, then the marker of the data, the frame counter and the converted data are successively transmitted in the numeric message. |
 The first anomaly is that the analog multiplexer generates a "90th frame" signal to reset the frame counter each time the frame counter has reached 90. But, this is absurd, the analog multiplexer has no information to reset the frame counter; only the frame counter itself has this information, and it is up to this counter to reset itself when it has reached a count of 90. |
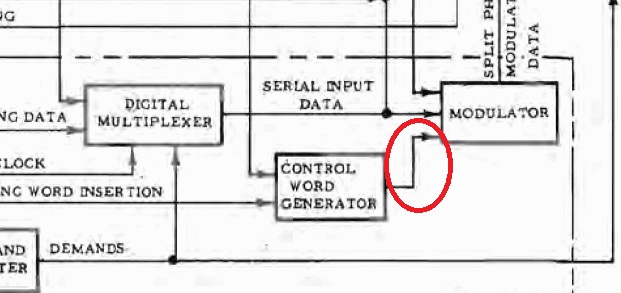 Then the second anomaly is that the output of the control word generator, which generates a frame from the sync word and the frame counter, directly goes into the modulator along with the serialized data coming from the digital multiplexer. But it cannot work this way; the modulator cannot modulate two separate trains of bits; the modulator should receive a unique train of bits containing the successive parts of the message to transmit. |
 This is the way it should work: The sync word and the frame counter going into the digital multiplexer, so that the multiplexer can successively select the consecutive parts of the message and serialize them (the parity bit could be computed as the train of bits is processed, and transmitted last); the created train of bits then goes into the modulator, in which it modulates a high frequency carrier. |
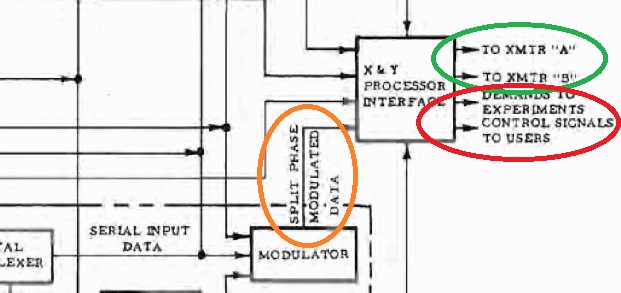 Then the block "X&Y processor interface" receives the modulated signal and outputs the transmission signals "XMTR A" and "XMTR B", which is normal. But what have the outputs "Demands to experiments" and "Control signals" got to do with this block? |
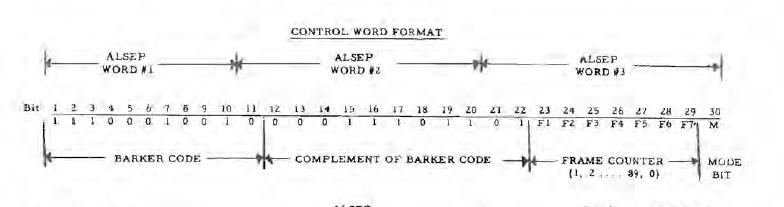 In the control word of the message, we find twice the marker code, one normal, and a second time in complemented form. They say that the marker code is followed with its complement for a purpose of synchronization. But it is completely absurd to make the synchronization this way: Suppose a bit of either the marker code or its complement is incorrectly transmitted, and the beginning of the message will be missed. There exists a much better way to make synchronization: In the NRZ format, a 1 bit represents a given level, and a 0 bit another level; there exists a third zero level for no transmitted bit at all, and this zero level, which is neither a 1 nor a 0, can be used to separate the frames, and synchronize them; it can be repeated enough to ensure a total security of the message; it is a much surer way of synchronization than complementing the marker code which only makes the message longer without really securing it. |
 This is the antenna of the ALSEP which transmits to the earth the informations that the central station gets from the devices attached to it, and also receives the commands from the earth. In order to properly work, this antenna must be oriented as accurately as possible toward the earth.  We can see a close-up of this antenna of the photo AS17-134-20491.  This is the description of the aiming mechanism in the documentation of the ALSEP. 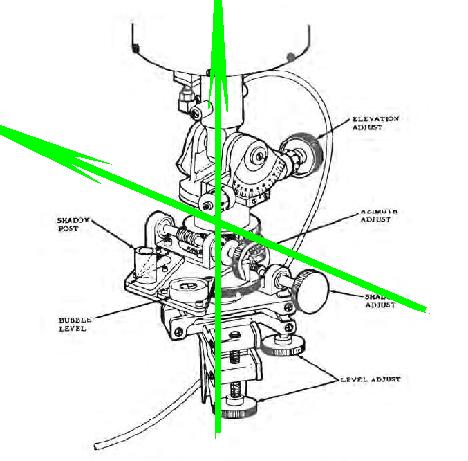 In order to be oriented toward the earth, the antenna had to be oriented around two axes, a horizontal one (to adjust an angle called "elevation"), and a vertical one (to adjust an angle called "azimuth"). In order to do that, the astronauts were instructed to make two adjustments. 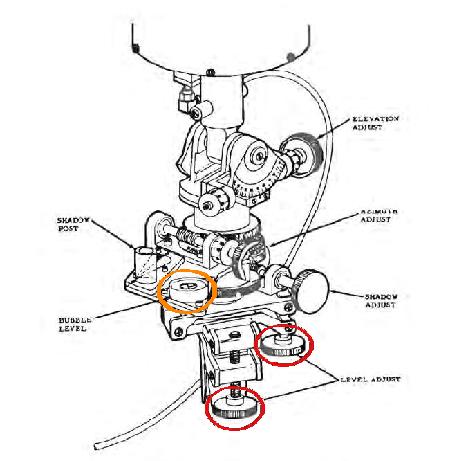 One adjustment to level the base of the antenna horizontally relatively to the moon, made with the two knobs I have circled in red: the horizontality was achieved when, on the bubble level (circled in orange), a bubble was centered in its circle.  And one adjustment to orient the antenna relatively to the sun by making a shadow alignment. The purpose was to put the antenna in a moon/sun reference system. But why make this adjustment, why not simply aim the antenna toward the earth?  The explanation which is given by the NASA is that the earth does not have a completely steady position in the lunar sky, but its position varies a little inside a libration zone. So, if the antenna is oriented to point at the current position of the earth, when the earth is on the opposite point of the libration zone, the reception would be less good; in order to always averagely have a quite good reception, the best is to aim the antenna not at the current position of the earth, but at the center of the libration zone.  The moon horizontality and sun's shadow adjustments would allow to put the antenna in a reference which would be in a plane which is locally tangential to the moon, and along the local longitude. Then the NASA would compute the angles of the libration zone's center relatively to this reference system et indicate them on the checklist of the astronaut; once that the astronaut has made the adjustments to put the antenna in this moon/sun reference system, he just has to set the two upper knobs on the predetermined angles which are indicated on his checklist, without having to aim the antenna at the earth. How marvelous!  So, let's summarize: the astronaut first adjusts the horizontally relatively to the moon with the knobs 1 and 2; then he makes a shadow adlustment with the knob 3; and then he just has to set the knobs 4 and 5 on the predetermined values indicated on his checklist; no need to orient the antenna toward the earth. And this is supposed to be a precise adjustment? Making the horizontality adjustment with the air bubble is far from being precise, it is rather a coarse adjustment. So, even if the angles are specified with much precision (two decimals), an adjustment made from a imprecise reference remains an imprecise adjusment.  Why didn't they just aim the antenna at the earth, and then make a correction on the azimuth and elevation (with values indicated on the checklist) so that the antenna is oriented toward the center of the libration zone instead; only an adjustment of horizontality would have been needed, the sun adjustment would have been ignored. 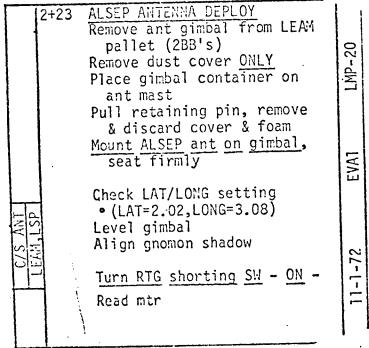 The adjustment angles of the antenna indicated on the Apollo 17 checklist seem rather low. 2.02� of latitude is a really low angle for an elevation angle. 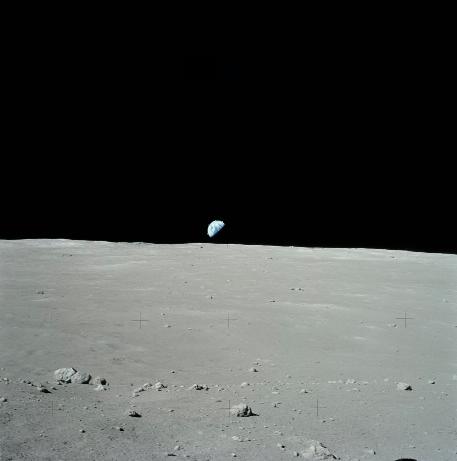 It would place the earth just above the horizon, much lower than what we see on the photos. You'll notice that the angles indicated on the checklist are the values of the latitude and longitude of the landing site of Apollo 17 divided by 10. Someone has suggested that the man who made the checklist was meaning the latitude and longitude of the landing site instead of their tenth, but it could not be the latitude and longitude of the landing site anyway, and I am going to explain why. 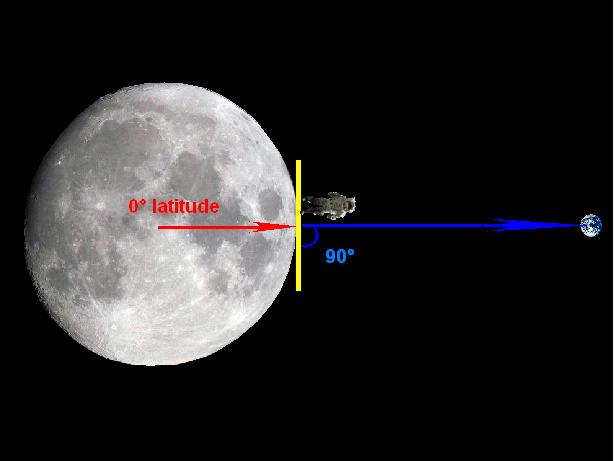 If the landing site was at the moon's equator, its latitude would be 0�, and the earth would be at the vertical of the landing site (or more exactly the center of its libration zone); the astronauts would see the earth just above their heads, and the latitude of the earth relatively to the landing site would be 90�. The yellow bar on my schema represents the orientation of the local horizontal plane. And don't wonder that I made the earth much smaller than the moon on my schema whereas it is bigger, for I don't represent it with its real size relatively to the moon, but the way it is seen from the moon.  At longitude 0, once the horizontality of the base of the antenna has been obtained, the antenna should be turned of an angle equal to the latitude relatively to the local vertical to point toward the earth.  But the adjustment of the elevation was not made from the vertical, but from the horizontal. But the angle of the direction of the earth relatively to the local vertical is equal to the latitude only when the longitude is null; the longitude also contributes to increase the angle that the earth's direction makes with the local vertical, so also to make decrease the elevation angle. If the latitude is null and the longitude is 20�, the earth will be seen with the same elevation as when the latitude is 20� and the longitude is null. So, what happens with the elevation when both the latitude and the longitude are not null, which is the case for the landing site of Apollo 17? Well it is a little more complicated. 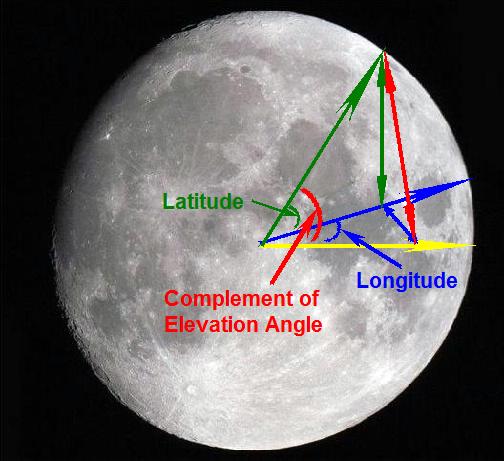 I'll use the following notations for my explanations: - I'll call the moon radius R. - I'll call the longitude L. - I'll call the latitude l. - And I'll call e the angle that the local radius makes with the rerefence axis of the selenographic system (the radius of null longitude and latitude), which is also the angle that the earth's direction makes with the local vertical. The perspective I have chosen for my schema may make appear angles different from what they are (for instance the blue double arrow is perpendicular to the yellow radius, although it does not appear so), but it was necessary to represent all the components without them hiding each other. According to the selenographic coordinates system, the landing site has too coordinates: - A horizontal coordinate which can be calculated from the longitude, which is represented by the blue double arrow on my schema, and which is equal to R*sin(L). - A vertical coordinate which can be calculated from the latitude, which is represented by the green double arrow on my schema, and which is equal to R*sin(l). - the distance of the landing site (represented by the red double arrow on my schema) to the reference axis can be calculated from the site's coordinates by using the well known Pythagoras theorem; it is equal to SquareRoot((R*sin(L))�+(R*sin(l))�)=R*SquareRoot(sin(L)�+sin(l)�) But this distance can also be calculated from the angle that the local radius makes with the reference axis, the one we are interested in; this distance is also equal to R*sin(e). So finally, we obtain the formula which gives us the angle e from the latitude and longitude: e=asin(SquareRoot(sin(L)�+sin(l)�)); this represents the angle that the direction of the earth makes with the local vertical, so the elevation angle is the complement to 90� of this angle. Finally, the formula to compute the elevation angle from the latitude and longitude is established as: Elevation angle=90�-asin(square root(sin(Longitude)�+sin(Latitude)�)) With the longitude and the latitude of the landing site of Apollo 17 (respectively 20.2� and 30.8�) this formula gives a result of 52� for the elevation angle. So, you can see that the elevation angle is not a direct relationship of the latitude, and that the longitude also modifies it.  The azimuth angle is the angle between the horizontal direction of the earth as seen from the center of the moon we see, and the horizontal direction under which it is seen from the landing site. It increases with the longitude, but conversely decreases with the latitude. The azimuth angle is positive when counted clockwise and negative when counted trigonometrically when the longitude is East, and it is the converse when it is West. The formula to compute the azimuth angle is: Azimuth angle=asin(R*cos(Latitude)*sin(Longitude)/R)=asin(cos(Latitude)*sin(Longitude)) With the latitude and longitude of the Apollo 17 landing site, is would give: Azimuth angle=asin(cos(20.2)*sin(30.8))=29�. So, you see that the elevation and azimuth angles to adjust the antenna with after having put it into the moon/sun reference system are far from directly being the latitude and longitude as an Apollo believer was thinking it. So, even if the man who made the checklist shifted the decimal point because he meant in fact to give the latitude and longitude of the landing site, as an Apollo believer has suggested, it is still wrong, for the azimuth and elevation fo the antenna are different from the latitude and longitude of the landing site and are rather complicated functions of both latitude and longitude. 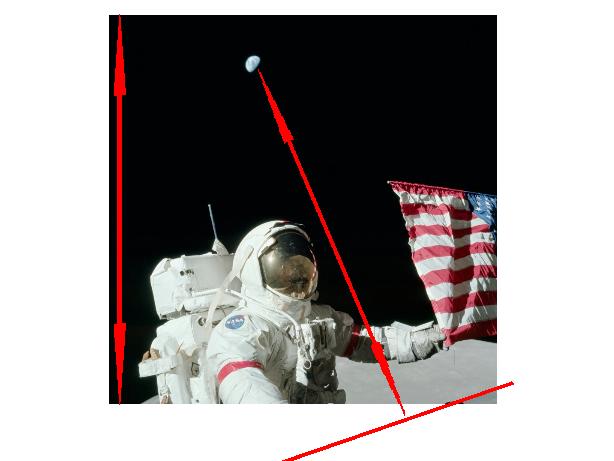 According to Clavius himself, the vertical angle of view of the photos of the missions would be 53.5�; it is quite close to the elevation of the earth of the landing site of Apollo 17 (52�); that means that the distance between the horizon and the earth's center is quite close to the height of the photo, very slightly less. When the horizon appears near the bottom on the photo, the earth appears at the extreme top of it. On this photo, AS17-134-20387, if I prolong the horizon line and that I draw a perpendicular line to the horizon line which crosses the earth, and that we compare the distance of the earth to this horizon line with the height of the photo, we can see that it is very close; the distance of the earth to the horizon line is slightly smaller than the height of the photo, like it should be, so the height of the earth seems coherent on this photo. It just confirms the elevation angle I have computed for the earth.  Now, on this photo, AS17-137-20957, it rings very differently. The earth seems really low relatively to the horizon. If we compare the distance of the earth relatively to the horizon and compare it with the height of the photo, we deduce that the earth would be only at an angle of 20� relatively to the horizon! 20� instead of 52�! So, what happened to this earth in this photo? Now, Apollo believers have pointed out that this photo is taken at South Massif, and what we see would not be not the horizon line but the line of crest of South Massif which is consistently higher than the horizon line; it would explain its proximity of the earth to it.  But there are two other photos on which we see the earth low relatively to the background line, with the same rock, very recognizable, which appears on them; the one of the left of the stereoscopic view is referenced AS17-137-20960, and the one of the right is referenced AS17-137-20961. If we compare the two rocks, the rock of the second photo is a little smaller, for I have measured the distance between two same points of the rock on the two photos, and found it was a little shorter on the second photo (shorter by 5 millimeters on my screen). That means the photographer has backed up between the two photos; but, if he backs up, and is oriented toward the ascending slope, it means he is getting down South Massif, and so getting lower relatively to its line of crest; that also means that the line of crest should appear closer to the earth on the second photo than on the first one. But, when I measure the distance of the earth to the line of crest on the two photos (on the second photo, I had to prolong the part of the line which is hidden by the rock), instead of finding a shorter distance on the second photo, I find a longer distance instead; longer only of 2 or 3 millimeters, but that's enough to say it is longer. We clearly have a contradiction here! The earth's libration could not act that fast.  If the NASA had really wanted to do things seriously, it would have made the ALSEP's antenna automatically follow the direction of the earth (by testing the position of best reception); if the NASA was able to remotely command the orientation of the rover's camera, why could it not do as much for the ALSEP's antenna? |
 And, frankly, when we see the ALSEP on the photo AS15-86-11592, it really looks like a piece of junk which is not able to get any information, or transmit anything! |
 The devices connected to the ALSEP were measuring data and transmitting them to the central station which was transmitting them toward the earth where they were recorded and plotted. I am going to show singularities on the plots recorded by the ALSEP. |
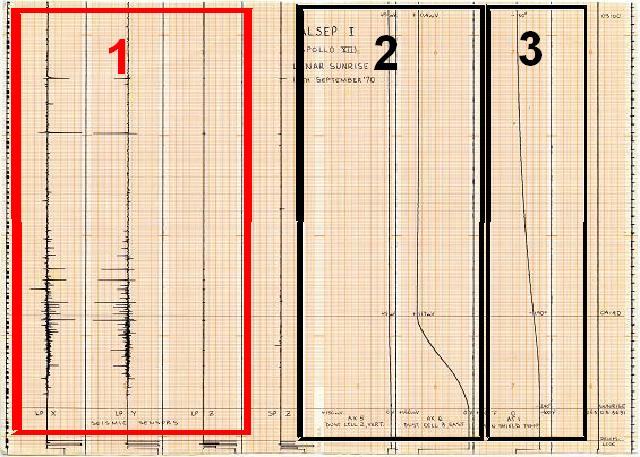
 This plot gathers the measures done by several devices of the ALSEP of Apollo 12 during the sunrise of the mission. |
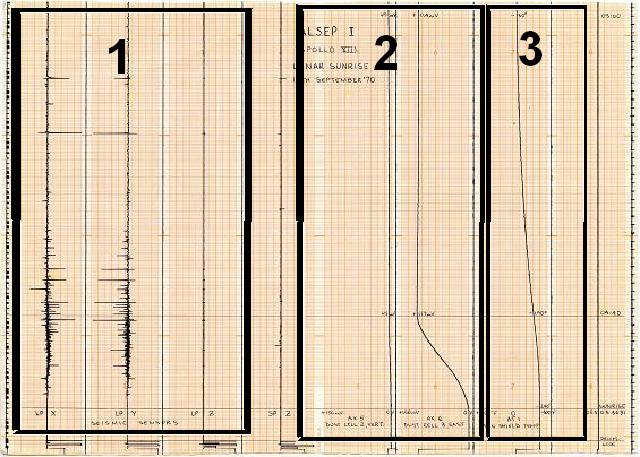 I'll successively show the different parts of this plot. |
 First the section 1 gathers the data of a lunar seism along the three spatial components X, Y, and Z (X and Y horizontal, and Z vertical). |
 We see the plots of the seism for each of the spatial components. |
 What is surprising is that the measure along the Z component is completely flat (or practically), which means that the lunar eathquake exclusively happened in a horizontal plane. |
 Furthermore we see quite a symmetry between the X and Y plots; the peaks of X and Y are most often synchronized and stay in the same direction. It means that the lunar earthquake would not only have happened exclusively in a horizontal plane, but also mostly along a given direction of this plane. |
 We'll now get interested in the measure of the dust cells. |
 The data measured by the first dust cell shows a slow progression of the dust, but the measure remains quite low. |
 Conversely, the data measured by the second dust cell progresses very fast in comparison, which means that this cell would detect much more lunar dust than the other one. Perhaps it was more exposed to the lunar wind! |
 There is another suprising fact about this second dust cell. Whereas its measure first progresses fast, it suddenly not only gets stabilized, but it even starts to decrease a little. So, after having fast gathered lunar dust, it would start to lose it? What happened? The lunar wind started to sweep the dust away? |
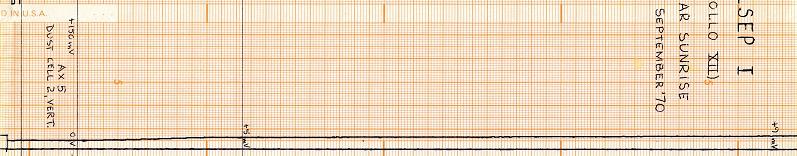
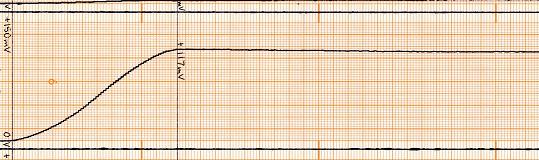
 We'll know get interested in the part concerning the sun shield temperature. |
 The sun shield temperature would almost look normal... |
 ...If it didn't start to change only after a while. Why didn't it start to change immediately after the start of the measure? Was it sleeping meanwhile? |
 And the last measure constantly remains flat. We can wonder if it was really necessary to record it. |
 This is the plot of a second seism occurred during the Apollo 12 mission. This time, the X and Y plots are flat, and the seism exclusively happens vertically The seisms are very strange on the "moon", they are very directional! |
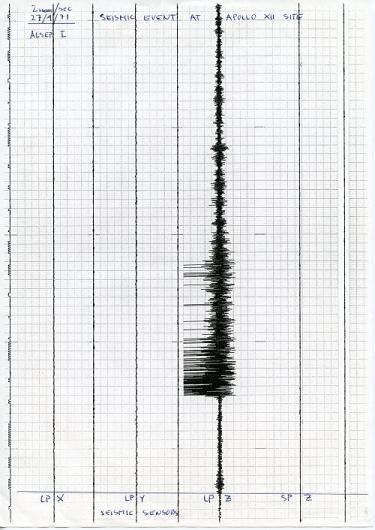
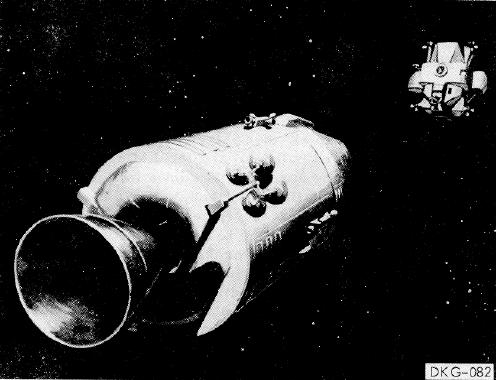 After the return of the LM to the CSM, and the LM docked to CSM, the LM was jettisoned. In Apollo 11 and Apollo 16, it was left orbiting the moon, but in the other missions, including Apollo 12, a deorbit maneuver was made on the LM to make it crash on the moon, so that the seismometers of the ALSEP could record its crash.  During the descent to the moon, in order to gain a lower orbit, the lunar module decreases its speed; this is supposed to make it take an elliptical orbit which will make it come closer to the moon at the other end of the elliptical orbit; they say that the LM loses around 75 feet/s to catch an orbit which makes it come to a lower orbit, at the altitude of 50000 feet (15km), at the other end of the elliptical orbit.  It means that the orbital speed of the LM ascent stage should be reduced enough so that the elliptical orbit, this reduction makes it take, becomes too short and cuts the moon. I have calculated that a reduction of 85 feet/s (~100 km/h) places the LM on an orbit which touches the moon on the other end of the orbit (i.e. altitude 0). It means that the necessary reduction of speed to make the ascent module crash on the moon should at least be equal to 85 feet/s. If the LM does nothing, it will not crash on the moon.  The report of he Apollo 12 mission says that the deorbit maneuver was remotely controlled, it was not pre-programmed after the separation.  The problem is that the deorbit command had to be sent almost a half orbit before the landing site for the LM to crash near the landing site, and, as the landing site is on the visible face of the moon, it means that the LM was on the hidden face of the moon when the deorbit command had to be sent; it means that the moon was then between the emitter and the lunar module when the deorbit command was sent; not an ideal situation for the LM to receive the deorbit order. OK, let's suppose that the LM could receive the deorbit command in spite of the difficulty of reception, and that the LM could execute it.  Hamish Lindsay says this about the impact of the ascent module of Apollo 12 on the moon: "When the Apollo 12 LM hits the lunar surface at 6,048 kilometres per hour, 72 kilometres from the landing site, digging an estimated 9 metre wide crater, the results were astonishing. All 3 seismometers in the package recorded the impact, which set up a sequence of reverberations lasting nearly an hour." And he shows this recorded plot of the event. But, in fact, when the LM crashes on the moon, it has a very important horizontal speed, but a relatively moderate vertical one; the important horizontal speed indeed creates a centrifugal force which counters most of the lunar attraction, and allows the vertical speed to increase only moderately.  It means that the crashing LM will hit the lunar surface almost horizontally; it will scrape the lunar surface rather than digging a local deep crater.  In earth atmosphere, it would have been much different, because the atmosphere slows down the important horizontal speed which converts into vertical speed instead. If the moon had had an atmosphere like the earth, the lunar module would have hit the lunar surface vertically with a great speed. But the moon has no atmosphere to slow down the important horizontal speed of the lunar module, and it is thence mostly horizontally that the lunar module hits the lunar surface. Besides, the fact that the LM hit the lunar surface almost horizontally is confirmed by this phrase in the mission report of Apollo 12: "The angle between the impact trajectory and the mean lunar surface was 3.7 degrees at the point of impact." 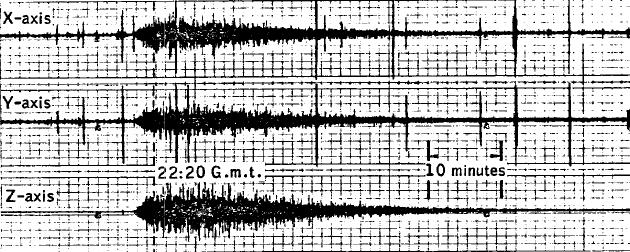 Yet, if we examine the plots of the three seismometers along the three axes (that I found in the mission report of Apollo 12 - Lindsay was only showing the one along the vertical axis), we can see that the plot along the vertical axis has more amplitude than the plots along the horizontal axes, when it should be the converse since, as I mentioned earlier, the impact of the LM on the lunar surface is mostly horizontal. Consequently it is the plots along the X and Y axes which should show the greatest amplitude, and the plot along the Z axis consistently less (it should have around the tenth of the amplitude of the horizontal plots). |
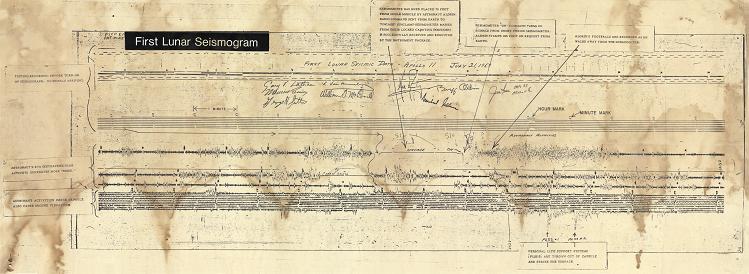 This is the first seismogram of Apollo 11. It looks like an old parchment of the middle age! |
 These people seem to say: "What is this bullshit!" |
 I doubt this mock station has ever recorded anything! |
