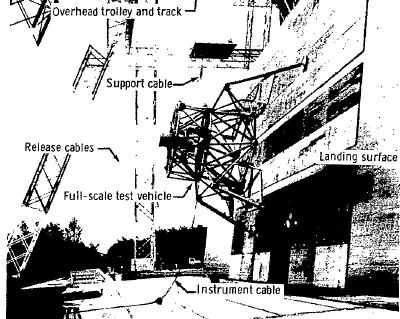
 This section deals about the lander of the lunar module, and the way it has been conceived and tested by the NASA. Link to the document which describes the lander: https://www.hq.nasa.gov/alsj/tnD6850LMLandingGearSubsytem.pdf |
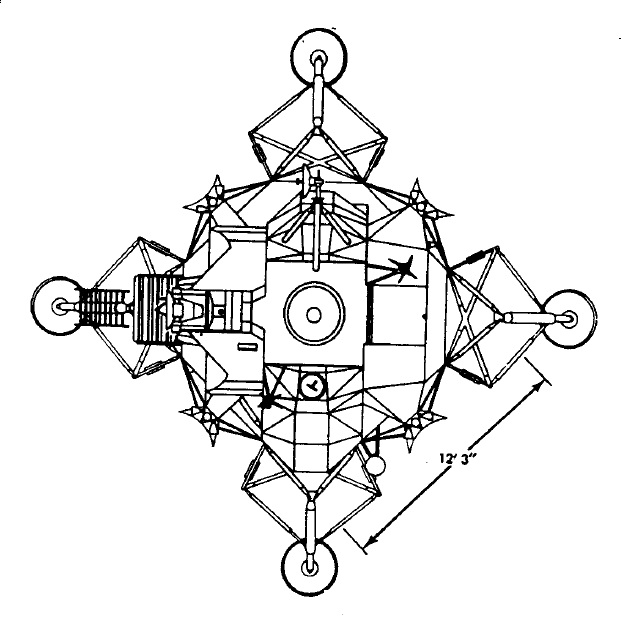
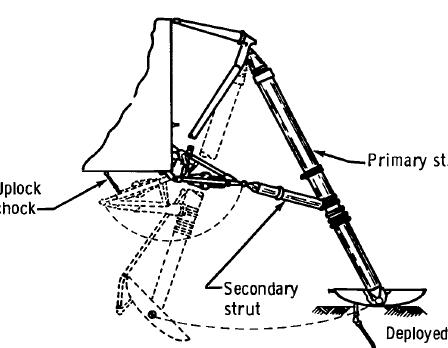 This figure extracted from the NASA documentation shows how the legs of the lander were stowed and deployed. |
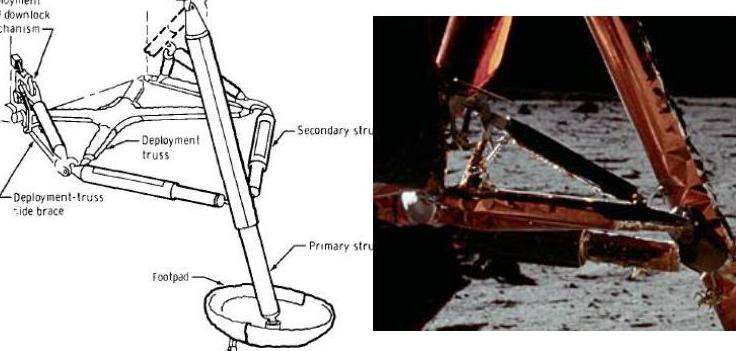 Normally, there are two secondary struts connected to each leg, but, on this photo of Apollo 11 (AS11-40-5850), we can see three secondary struts connected to the leg! And, on this photo of Apollo 11 (AS11-40-5920), we can see a secondary strut which is not connected to the leg: We can indeed see the lunar ground between the strut and the leg! 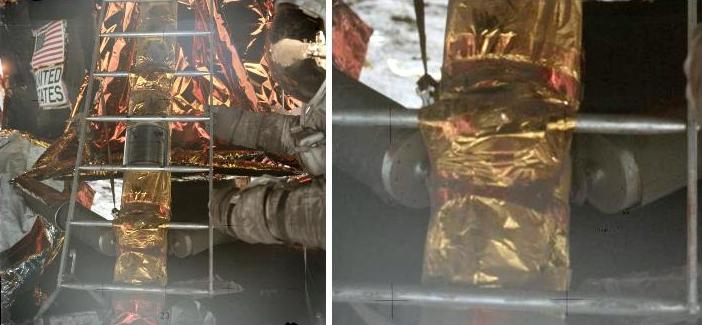 And, on this photo of Apollo 17 (AS17-134-20488), we can see that there is no connection between the secondary struts and the leg. 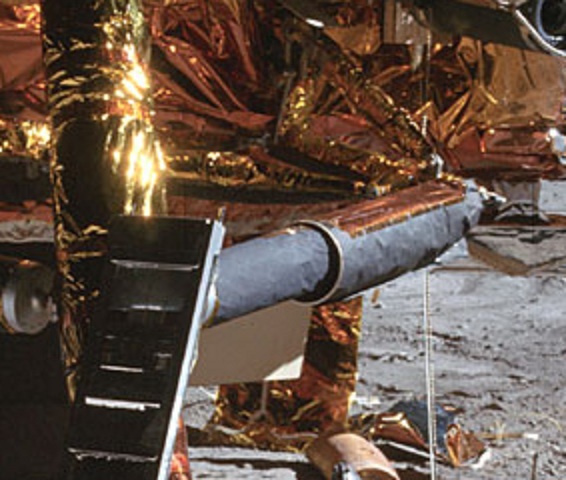 And what to think about the pitiful state of this secondary strut on a photo of Apollo 16 (AS16-107-17441); there should be a close contact between the two cylinders of the strut, and it appears that it is very far from it! |
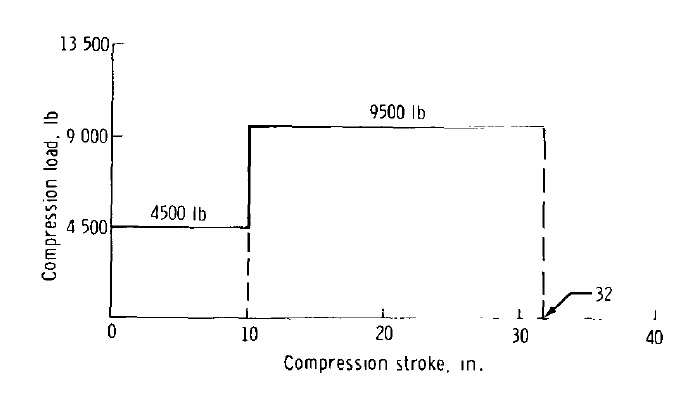 This figure gives the primary-strut compression load as a function of compression stroke; we would have expected a continuous representation on the graph, but we have instead a discontinuous one, by steps. What explains that the compression load remains constant as the compression stroke increases, and suddenly brutally increases to remain constant again thereafter? |
 It is obvious that, the faster the lunar module lands on the moon, and the more the lander will be stressed.  On the other hand, if the lunar module skids on the lunar ground, it will also generate a stress on the lander, and as much more as the horizontal velocity of the lunar module is higher.  And the stress generated by the horizontal move of the lunar module will be the same in whatever direction the lunar module moves.  And, if the lunar module has both a vertical and a horizontal velocity when landing, the combined actions of the vertical and horizontal velocities will both generate a stress on the lander. |
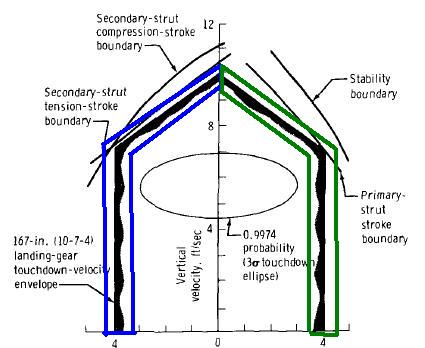 This graph represents the landing performance of the landing gear as a function of the vertical and horizontal velocities. We see a touchdown-velocity envelope which is symmetrical relatively to the vertical axis, which is normal, since the stress generated by the horizontal velocity is the same whether is is positive or negative; so nothing surprising here. 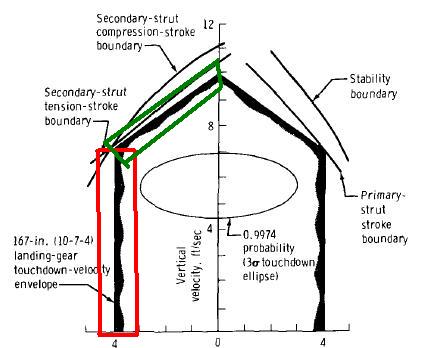 Now the first part of the touchdown-velocity envelope (framed in red) appears vertical; yet, as the vertical velocity increases, it requires less horizontal velocity to generate the same stress, which means that it should not be vertical, but bent, it should show a slope. Then, suddenly the touchdown-velocity envelope (framed in green) shows a slope it should have shown from the start. Why does it only show a slope from a given value of the vertical velocity?  The answer to this question appears obvious when we see how it is shaped: The touchdown-velocity envelope looks like a little house! That's why the touchdown-velocity envelope needed to be vertical at the start, in order to represent the wall of the house! This touchdown-velocity envelope is of course a total fantasy, a joke! 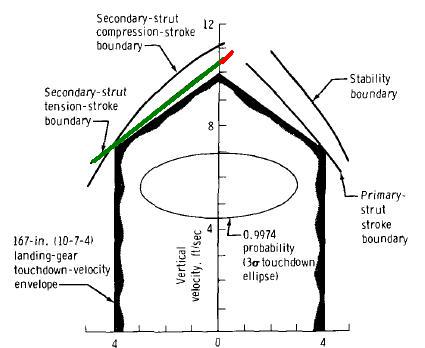 Then, why does the representation of secondary-strut tension-stroke boundary stops so abruptly? And the part I have outlined in red is incoherent, for it is not symmetrical with the other part of the representation; it should not be ascending, but descending. 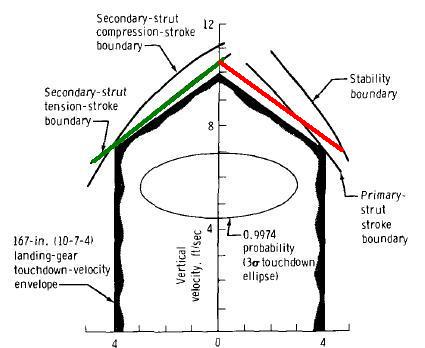 In fact, as the stress is the same whether the horizontal speed is positive or negative, we should see a symmetrical part on the other side of the graph (the side of the positive horizontal velocity), we should see a part I have drawn in red. 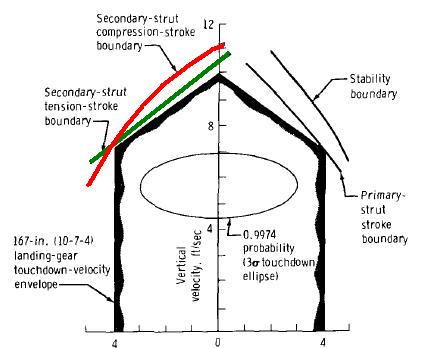 And it is strange that the secondary-strut compression-stroke is curved while the secondary-strut tension-stroke boundary is perfectly straight! 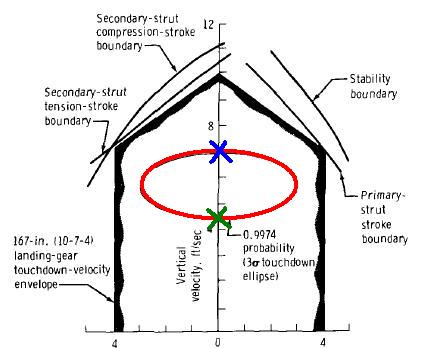 The ellipse I have outlined in red represents the 0.9974 touchdown probability; the two points I have indicated with a cross both have a null horizontal velocity and two different vertical velocities; how could they determine that these two vertical velocities could have this same very precise probability? |
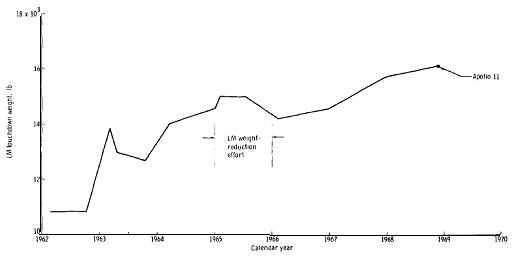 This graph represents the evolution of the touchdown weight of the lunar module with time. 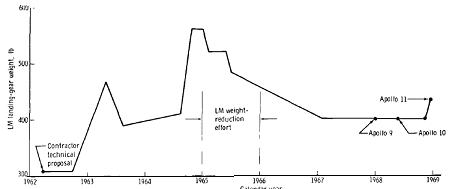 And this graph represents the evolution of the landing-gear weight of the lunar module with time. We can see that progress has been made to reduce the weight of the lander along time, which is of course a good thing. 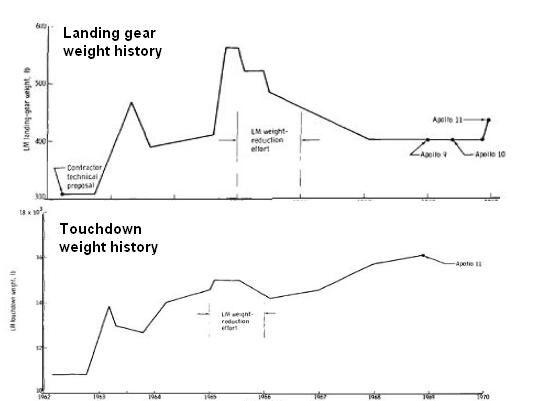 But why has not the touchdown weight of the lunar module also shown a reduction with time? If the touchdown weight of the module has increased in the same time that the landing-gear weight was decreasing, that means that they have abusively added weight in the lunar module, a weight which was countering the efforts to reduce the weight of the landing-gear! It is useless to reduce the weight of the landing gear, if the total weight of the lunar module increases in the same time! The touchdown weight of the lunar module should also have decreased in the same time as the landing-gear weight, so that the efforts to reduce the weight of the landing-gear are not useless! |
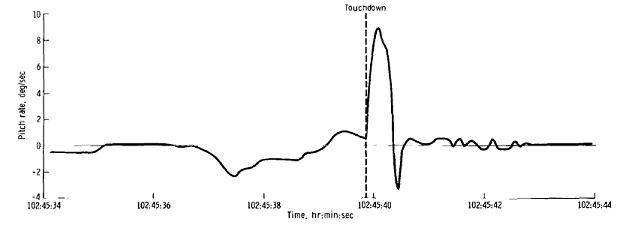
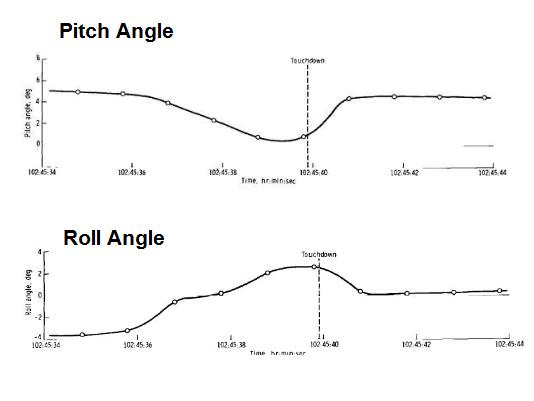 These graphs show that, in Apollo 11, the lunar module has landed with angles relatively to the moon, and not horizontally relatively to the lunar ground.  They say that, in Apollo 11, the lunar module pitched and rolled before landing; as a consequence, the lunar module touched the ground with two legs instead of its four legs; the reaction was of course that it pitched and rolled conversely, and then touched the ground with the two other legs before finally it landed on its four legs. The fact of touching the ground with only two legs instead of the four legs generates more stress on the two contact legs than if the lunar module was landing simultaneously on its four legs.  Normally, the lunar module should seek to take an attitude which makes it horizontal relatively to the lunar ground before landing, and then descend perfectly vertically, trying of course to control its vertical speed. It should also try to nullify its horizontal speed, so that the stress will only be generated by vertical speed and not by the horizontal speed; it should be able to do it by using its RCS.  On the earth, the LLRV seemed to have some difficulty to control its horizontal speed, but, on the earth, gusts of wind can make the LLRV move horizontally, which makes that it has difficulty to control its horizontal speed.  On the moon, there is no wind, so it is easier for the lunar module to control its horizontal speed, and it should normally be able to control and nullify it with its RCS, which is advisable in order to avoid the stress on the lander generated by the horizontal velocity.  Was it easy for the astronauts to check if the lunar module was horizontal relatively to the moon? First, the astronauts had a camera mounted on the top of the LM which was allowing them to visualize the lunar ground. 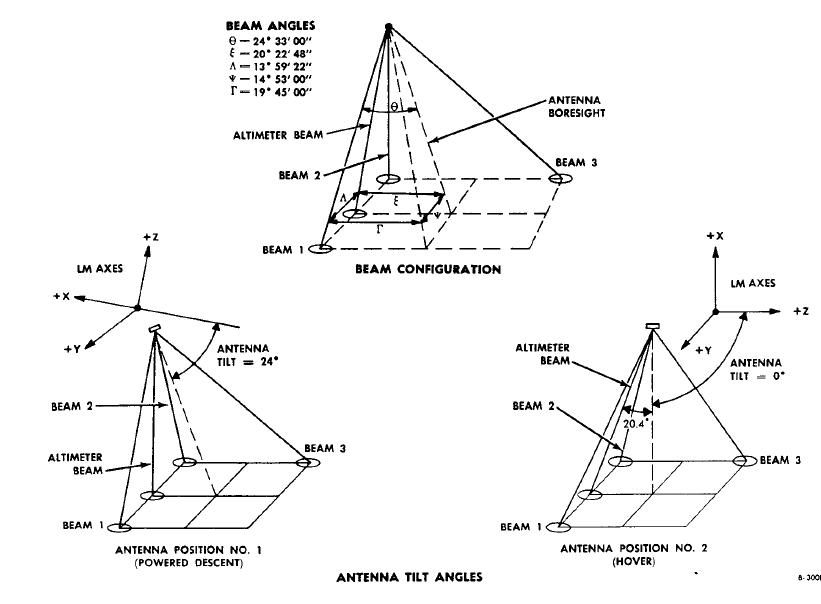 And secondly, the lunar module was equipped with lateral radars which could give information about the orientation of the lunar module relatively to the lunar ground; these lateral radars could help to orient horizontally the lunar module relatively to the lunar ground. So normally, the lunar module should first be stabilized and oriented horizontally relatively to the lunar ground before landing, and descend vertically. |
 This graph gives the representation of the pitch rate (speed) along time, the time scale is the same as for the graph of the pitch angle. 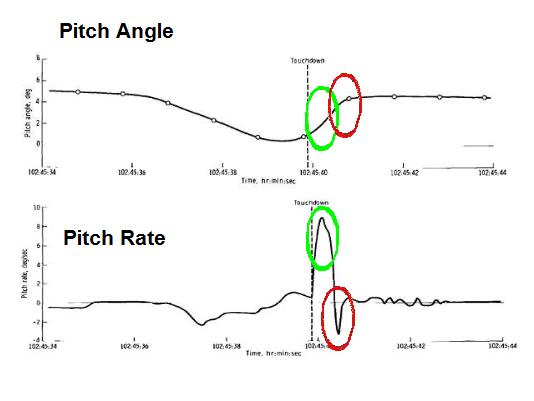 If we make a comparison between the pitch angle and the pitch rate, we can see an anomaly that I am going to explain. The part of the pitch rate I have circled in green corresponds to a positive pitch rate; this corresponds to an increase of the pitch angle we can effectively see on the graph of the pitch angle (on the part I have circled in green). But the part of the pitch rate I have circled in red corresponds to a negative pitch rate; this corresponds to a decrease of the pitch angle; but we can't see this decrease on the graph of the pitch angle, for this part of the pitch rate corresponds to the part of the pitch angle I have circled in red on the graph of the pitch angle, and we can see that this part of the pitch angle is not decreasing, but increasing instead! |
 This graph gives the representation of the roll rate (speed) along time, the time scale is the same as for the graph of the roll angle. 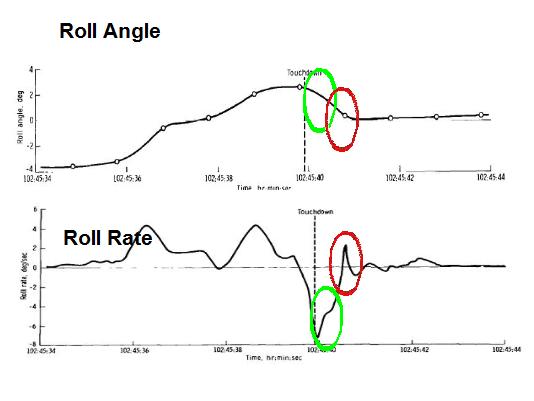 We have the same type of incoherence on the roll angle as we had on the pith angle, but inverted. The part of the roll rate I have circled in green corresponds to a negative roll rate; this corresponds to a decrease of the roll angle we can effectively see on the graph of the roll angle (on the part I have circled in green). But the part of the roll rate I have circled in red corresponds to a positive roll rate; this corresponds to an increase of the roll angle; but we can't see this increase on the graph of the roll angle, for this part of the roll rate corresponds to the part of the roll angle I have circled in red on the graph of the roll angle, and we can see that this part of the roll angle is not increasing, but decreasing instead! |
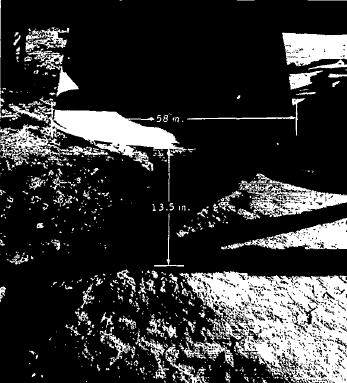 The NASA relies on a photo of Apollo 11 (AS11-40-5864) to determine the distance of the engine to the ground after the landing. 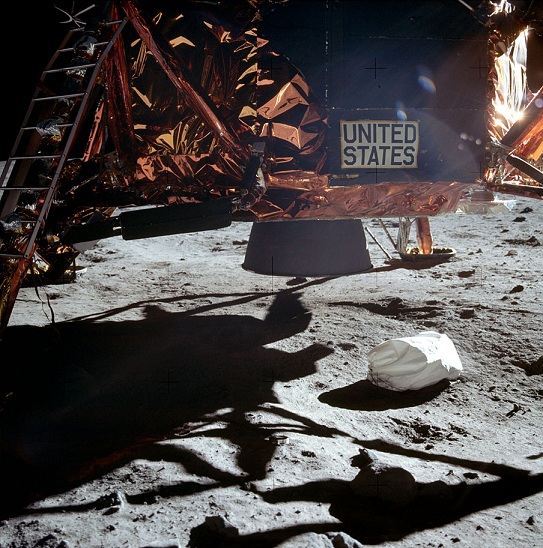 The problem is that the crater we see under the engine on this photo has obviously not be caused by the exhaust of the engine, but is a natural crater of the ground, for it is not centered under the engine; if it had been caused by the exhaust of the engine, it would be centered under the engine. That means that, if the lunar module had shifted just a little, the engine would not be above this natural crater, and the distance of the engine to the ground would not be the same! |
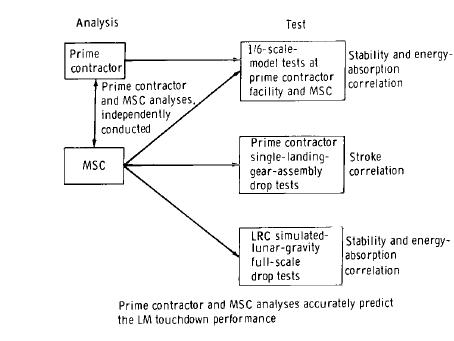 This figure represents the validation of the touchdown-analysis mathematical model by comparison of the analyses of the prime contractor with those of the MSC, independently conducted. That supposes that both the prime contractor and the MSC make all the analyses. But, on the figure, the prime contractor does not make all the tests; so, how can the tests he does not make be compared with those of the MSC? 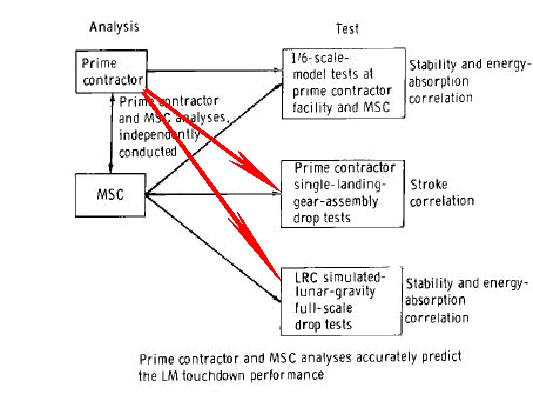 We would have expected to see the missing arrows I have drawn in red. |
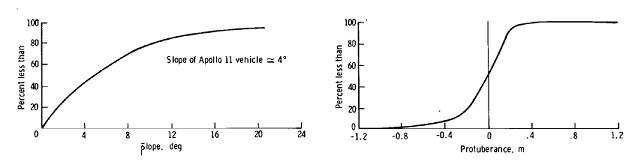 They say they were able to establish graphs representing the lunar surface by using the photos taken by the LRO. 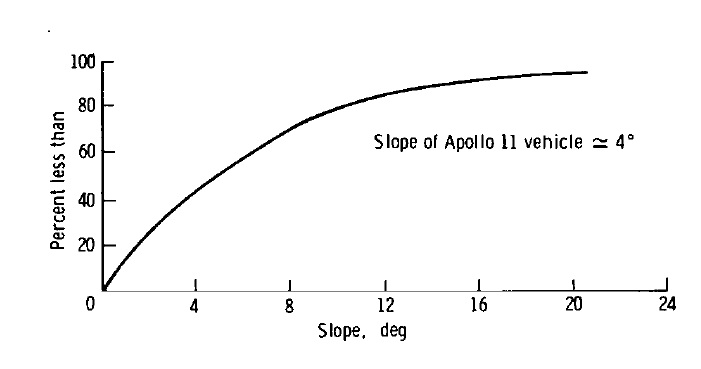 For instance, this graph says that 40% of the lunar surface has an angle of less than 4� relatively to the gravitational vertical, 60% of the lunar surface has an angle of less than 8� relatively to the gravitational vertical, 80% of the lunar surface has an angle of less than 12� relatively to the gravitational vertical... But, how could they determine that from the LRO photos which only give a 2D representation of the lunar surface? |
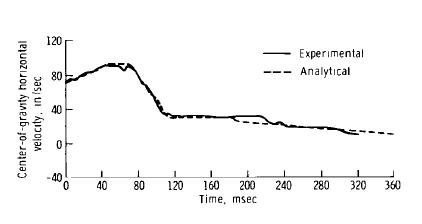 This graph gives a representation of the horizontal velocity as a function of time; the continuous line represents the experimental velocity and the discontinuous one the analytical velocity. 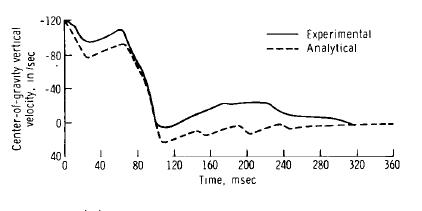 Likewise, this graph gives a representation of the vertical velocity as a function of time; the continuous line represents the experimental velocity and the discontinuous one the analytical velocity. 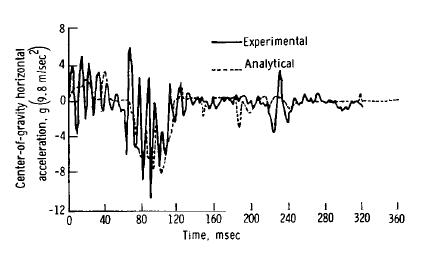 This graph gives a representation of the horizontal acceleration as a function of time; the continuous line represents the experimental acceleration and the discontinuous one the analytical acceleration. The time scale is the same as for the horizontal velocity. 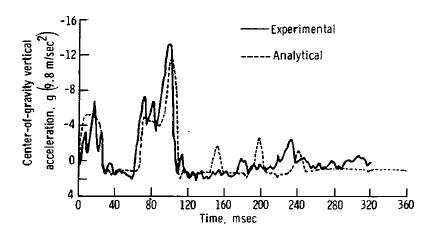 Likewise, this graph gives a representation of the vertical acceleration as a function of time; the continuous line represents the experimental acceleration and the discontinuous one the analytical acceleration. The time scale is the same as for the vertical velocity. 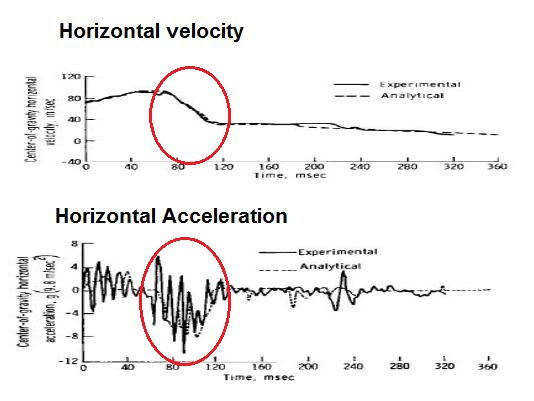 If we compare the graph of the horizontal velocity with the one of the horizontal acceleration, I won't surprise you if I tell you that, once again, we can see an incoherence in this comparison. In the part of the horizontal acceleration I have circled in red, the experimental acceleration appears to be very different from the analytical acceleration, which varies much less...yet, on the same time period, the experimental and the analytical velocities are practically confused! 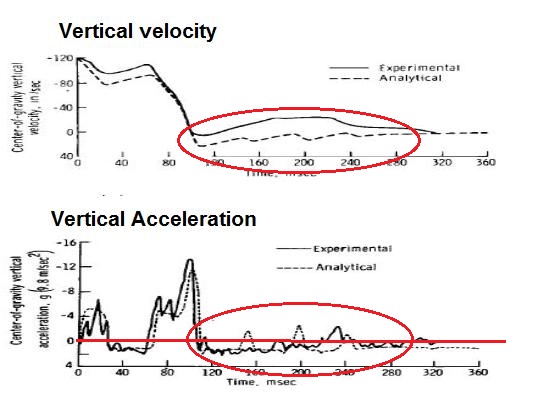 If we compare the graph of the vertical velocity with the one of the vertical acceleration, we also find something abnormal. On the part of the graph of the vertical acceleration I have circled in red, the analytical acceleration (the dotted line) is more often under the zero reference (I have drawn in red) than above; that means that the analytical velocity of the same period of time (the one I have circled in red on the graph of the vertical velocity) should show longer descending slopes (corresponding to a deceleration) than ascending slopes (corresponding to an acceleration); but it is not at all the case: the graph of the vertical velocity shows longer ascending slopes than descending slopes instead on the part circled in red. |
 They say that they could simulate the lunar gravity by using an inclined plane and supporting cables! What a joke! |
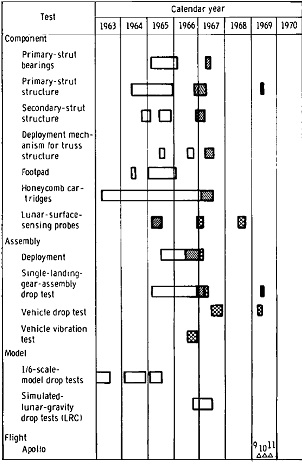 This figure shows how the development of the landing-gear was managed. For each part of the landing-gear, a hollow rectangle represents a phase of development, and a hatched rectangle a phase of test. 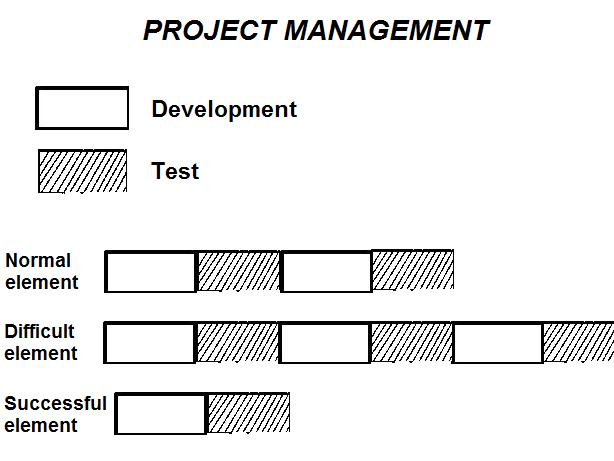 Normally, in a project, most times, when you test an element, you realize that some improvements have to be made; you make these improvements, and test again to check is now the element is OK. In some cases, a second test shows that some improvements still need to be made, and several tests may even be needed in difficult cases before an element is considered to be working functionally. Of course, it may happen that the element shows to be perfect at the first test, and needs no further improvement. But it is unlikely that all the elements of a project would be perfect at the start. So, what are the strange facts in the development of the landing gear? - The tests are not always made just after the development, we can see that, sometimes, there may be some time between the end of the development of an element of the project and its test. - we can see that some elements are certified without ever having been tested. - Some elements are developed, but not tested. - and there never is a new development after a test, which means that all developments are perfect! |
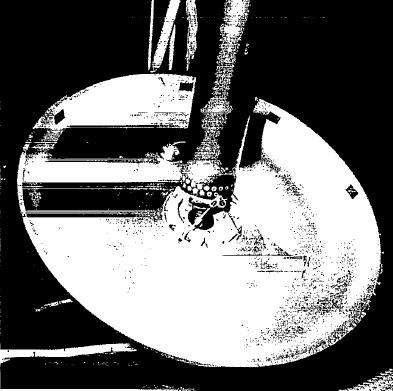 This figure shows how the leg is articulated to the footpad. This articulation seems rather strange. 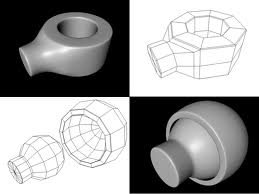 The articulation between the leg and the footpad consists in a ball rolling in a socket, so that the footpad can turn around the leg.  Normally, in a ball-and-socket joint, the ball has the same diameter has the socket in which it rolls, or almost, so that there is a good contact between the ball and the socket, and the ball turns smoothly in the socket.  If the ball is smaller than the socket, the ball will move in the socket, it will not be tightly maintained, it will be loose; it may even eventually break.  And also, since it is not correctly maintained by the socket, the ball can get out of it. 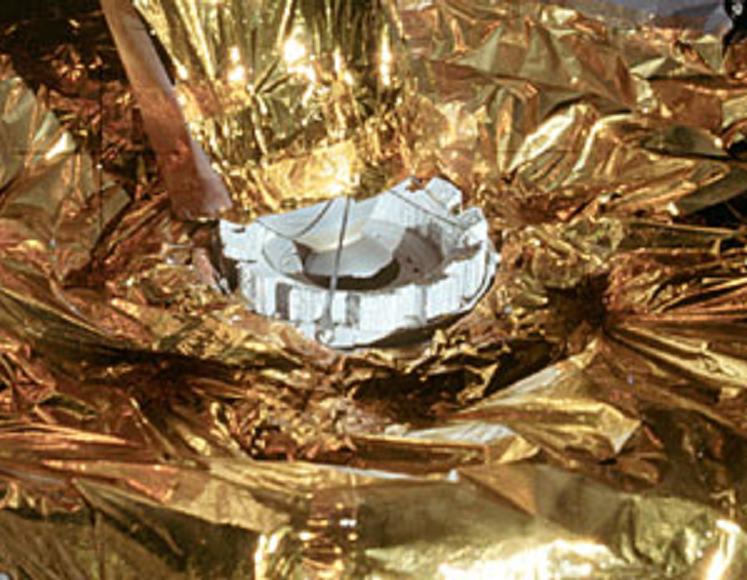 On this photo of Apollo 11 (AS11-40-5926) showing a close-up of a footpad, we can see that the ball of the leg does not fill the socket of the footpad; there is obviously void between the ball and the socket which means: - That the ball of the leg is small and thence fragile. - That the ball of the leg is loose in the socket and not maintained by it; we can see wires which are supposed to prevent the footpad from being separated from the leg, but these wires seem thin in comparison with their function! If a too great effort is exerted on them, they will break, and bye bye the footpad! |