Allow students
to investigate sciences, math, and geography in a process-orientated way.
Permits
the student to become excited about science when they investigate it through
instrumentation, tangible measurements, recording quality data and processing
results.
There are four 1 - 2 hour modules that can be designed and altered to suite specific science curriculums, classes and/or teacher needs.
Module 1 - Intro and Background to weather observations. Background of field observations, the use of data sheets, data recording and an overview of hand-held recording instruments.
Module
2 - Manual measurement data collection, recording, processing and interpretation
Background and introduction into the use and application of weather
stations and site selection.
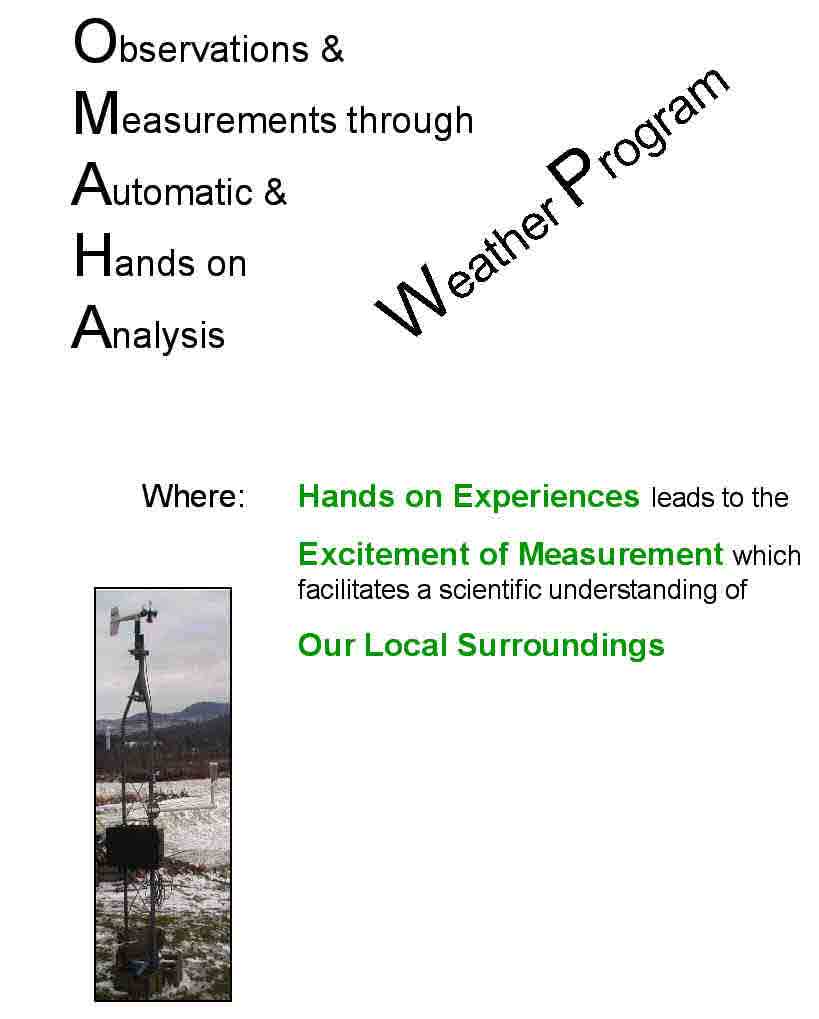
Module 3 - Installation and set up of automatic weather tower. Initial hand held measurements and observations.
A.M. Environmental
Automation & Control
A.M Environmental Automation & Control brings broad-based micro-meteorology to schools.
With TEAM:
Students develop, analyze, compare and contrast micro-meteorological data simultaneously generated by automatic weather stations.
Students install and maintain weather stations at 2 different schools
The TEAM (Tandem Environmental Assessment and Measurement) program is a multidisciplinary learning program where project based curriculum is used to answer physical and environmental science questions. The program involves schools regionally where collaboration and data sharing are essential in the explanation of how weather measurements compare and contrast a locality. Students involved in the TEAM program investigate science, math, geography, and technology with a met station at two different sites. This program can be designed and altered to suite specific science curriculums, classes and/or teacher needs. Below is a conceptualized logistical timeline of the TEAM program.
1. Teachers and AMEAC guide students through met station installation and testing. Teams of students assess site:
2. Dataloggers are cleared of all data and both schools (see figure below) simultaneously start official recording scheme with the same storage interval and sensor recordings.
3. Dataloggers are checked by students for adequate power. Manual measurements of temperature and other variables are recorded as controls over the week recording period
4. After some days, the data is retrieved and processed, the information recorded is used to characterize the site and it is compared with the data from the other school.
Expected Outcome
The
graphs below are conceptualized results based on data gathered at two different
schools at identical times. One school resides on the north side of a mountain
(graph A) where total sunlight and cold air drainage may affect temperature
and sunlight. The other graph (B) in contrast depicts a school in a more open
area with less shade and geographic influences.