
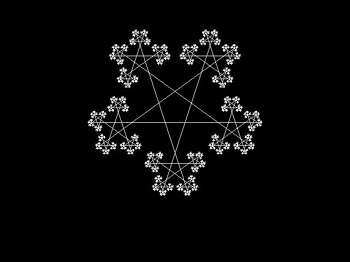
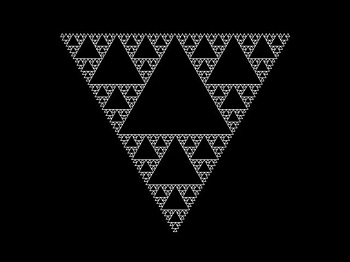
The fractals shown in (1) (2) & (3) have been created using mathematical formulas. Although these fractals are interesting to look at, they are not the types of fractals that I am really interested in. My interest is in fractals that will require you to use your IMAGINATION because they are involved with imaginary numbers.
Most people know that the equation: Xý-1=0 is the same as saying Xý=1 and is asking one to find the square root of 1. The fundamental theorem of algebra says there are N roots for an equation of degree N. The little "2" above the X tells us that there are two roots or answers: +1 and -1.
If we see the equation: Xý+1=0 it is the same as saying Xý=-1 and we
are to find
the square root of -1 and that there should be two roots or answers. Now we are
required to use our IMAGINATION and say the roots or answers are:
+1 imag. and -1 Or as mathematicians say: +1i and -1i.
We have now entered into the world of imaginary numbers. These are
REAL numbers. By definition: iý = -1 and that i is the square root of -1.
It is easy to visualize this by seeing the similarities between the Euclidean plane and the "Imaginary" or Complex Number plane which we use to plot numbers.

THE EUCLIDEAN
PLANE
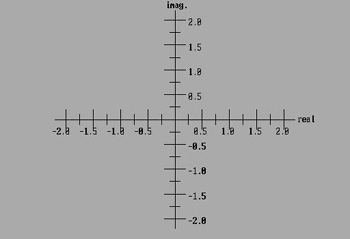
THE COMPLEX PLANE
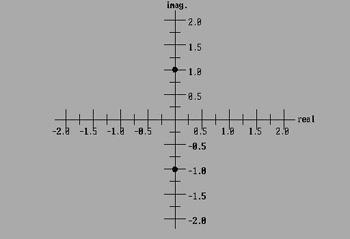
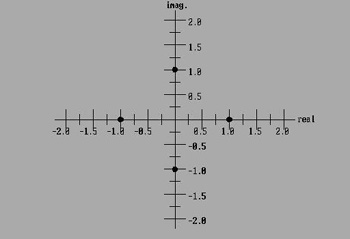
We can now plot the roots of Xý-1=0 and of
Xý+1=0. PLOT OF Xý=1
PLOT
OF Xý=-1
Complex numbers consist of two parts: real and imaginary. Just as we
can plot a number (X,Y) in the Euclidean plane we can plot (real,imag.) in the
Complex plane. For the square root of 1 we plot two numbers: (1,0i) and (-1,0i).
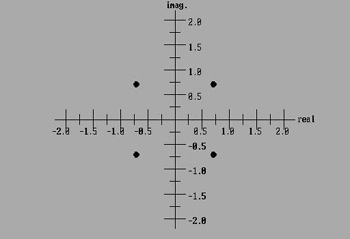
For the square root of -1 we plot two numbers: (0,1i) and (0,-1i). Let's look at the plots for the X°=1 and X°=-1. The little
"3" above the X tells us that there are three roots or answers. PLOT OF X°=1
PLOT
OF X°=-1
Let's add the plots for the fourth and fifth roots of +1 and -1.
If all of the roots of +1 and -1 that have been plotted so far are
combined on one graph we start to see a very distinct pattern evolving.(The
"dots" used represent "points" and should be much
smaller.)
First we need to define the screen area that will contain our fractal. We are This means that we will actually plot 307,200 points! Here is what the screen area will look like:
One of the unique qualities of the number 1.0 is seen if a number
slightly less than 1.0 and slightly greater than 1.0 is squared and
the result is then squared and its result squared, etc. For example:
By following this process we see that the number .9 will go toward zero A grid will be added set to the color GREEN.
(Save the program to disk and use off-line)
The WHITE CIRCLE contains most of the roots of "+1 &-1".
The RED area is where points outside of the fractal have escaped to infinity.
The BLUE area is where points are captured and form the fractal.
The fractal is called a STRANGE ATTRACTOR" because the WHITE area is highly unstable. It is one
of the famous JULIA fractals named for the great mathematician,
Gaston Maurice Julia (1893-1978). Julia, at the age of 25 published
"Memoire sur l'iteration des functions" which dealt with
iteration functions.
Here is a Julia fractal showing most of the roots
of 1. JULIA FRACTAL C = (0,0i) To end the series of our study of the number "1" it is
interesting to see that all of the roots of "1" we have
looked at so far, can be fractalized. The system used is a modified
Newton's method for solving high-degree algebraic equations.


 PLOT OF X4=1
PLOT OF X4=-1
PLOT OF X4=1
PLOT OF X4=-1

 PLOT OF X5=1
PLOT OF X5=-1
PLOT OF X5=1
PLOT OF X5=-1
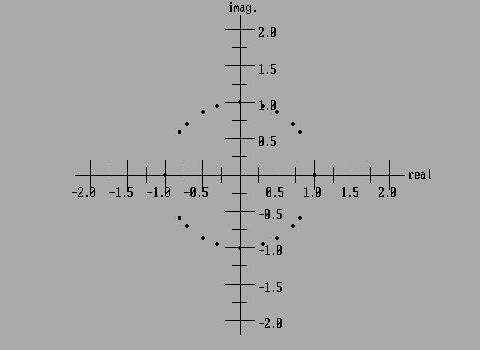 PLOT OF THE FIRST 5 ROOTS OF +1 and -1.
FOR A PROGRAM THAT PROVIDES THE ROOTS OF ANY NUMBER, USE THE
FOLLOWING:
Click here for a ROOT SOLVING PROGRAM.
(Save the program to disk and use off-line)
WITH THIS KNOWLEDGE, WE CAN PROCEED TO BUILD A FRACTAL IN THE COMPLEX (Z) PLANE.
going to stay with the number 1.0 which has some very unique qualities.
The screen will have a 3/4 aspect ratio similar to the monitor screen. The x-axis
will be divided up into 640 parts and the imaginary-axis into 480 parts.
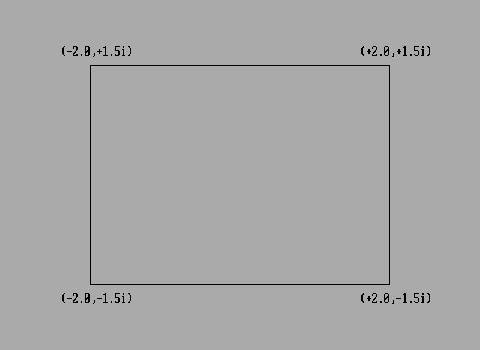 SCREEN SET UP FOR PLOTTING THE FRACTAL.
.91=.9000 1.11=1.1000
.92=.8100 1.12=1.2100
.94=.6561 1.14=1.4641
.916=.1853 1.116=4.5949
.9256=1.9323e-12 1.1256=3.949e10
and the number 1.1 will go toward infinity if they continue to be squared.
Ten iterations of this kind should prove to be sufficient. If we start with
the number (-2.0,-1.5i) and continue to the number (2.0,1.5i) going up 480
steps and across 640 steps and plot the points on our screen, we will see an
interesting and familier pattern. All the numbers that tend toward infinity we
will set to the color RED. All of the numbers that tend to go toward zero we
will set to the color BLUE. Any others we will set to the color WHITE.
Click here for a OUR NEW FRACTAL PROGRAM


Click here for a NEWTON 3RD ROOT MOVIE
Click here for APPENDIX A
MORE ABOUT FRACTALS TO BE ADDED SOON