1.9 Kilojoule Coil Gun Results
Email: sixmhz@yahoo.com
Link to my Homepage
Link to main Coil Gun page
Link to the X-Gun low energy coil gun page
Link to the 1.9 kJ Coil Gun
Link to the Permanent magnet repulsion coil gun page
Link to velocity determination circuitry, Event timer
Introduction
This page was created in order to more fully understand and characterize coil gun performance. Also, since I can't seem to find any other creditable information on the net, it provides base-line information for all coil gun makers.
The Measurement System

The measurement system is comprised of the optical sensors, signal conditioning unit and a universal
high speed timer/counter. The optical sensors are two sets of
infrared diode/photo transistor pairs.
These photo-detectors pass an infrared beam through an extension tube mounted on the barrel.
As the beam is blocked by the projectile upon passage, the photo-detector signal is transferred to the
signal conditioning unit. This unit inverts and amplifies the signal and also includes a Schmitt
trigger to clean up the rough waveform into a fast rising signal, more easily detected by the counter.
This conditioned signal is then routed to the high-speed universal counter/timer pictured above. This counter is
a HP5328A that I purchased through e-bay for $20. It is fairly old and was pretty thrashed when I
got it. With just a few hours of TLC and a couple of new knobs and dials, it was again functional. This
particular counter can measure pulses as short as 10 ns, way fast enough for this project!
Initial Results

Ok, so now we are getting somewhere. Over to the right is the initial round of data collected using this new
timer system. The first figure is the velocity in miles per hour (mph) as a function of the capacitor bank
voltage (Volts) for this coil gun operating with one, two and all three coil stages. From this figure you can clearly
see that the velocity is proportional to the bank voltage as it should be. It is also very apparent that the more stages
utilized (and more energy), the higher the velocity. But one thing that isn't quite right is that the curves for the
two and three stage data don't seem to be quite linear (straight line) as you would expect. We get it right with the one stage,
but it gets worse for two and three. It is also important to note that the two and three stage profiles start out being
linear, but after the voltage gets hiked up a ways they deviate from linearity. More about this in a moment.
The next figure is the overall efficiency transfer from potential to kinetic energy as a function of capacitor bank
voltage. You can see that for single coil operation that the energy transfer efficiency is approximately independent
of bank voltage, stuck at about 1%. But if you look at the two and three stage modes, the efficiency seems to be
strongly dependant on the bank voltage. How come?

Well if we study this and the previous figure, it's not too hard to see what's going on here. Look at the efficiency
chart: the maximum efficiency with the two stage system occurs when the bank voltage is at 175 Volts. From the velocity figure,
this bank voltage corresponds to a velocity of about 45 mph. Back to the efficiency chart: the maximum efficiency of the three
stage system comes at a bank voltage of 125 Volts. Again from the velocity chart, this happens to correspond with a three
stage velocity of..45 mph! Coincidence? I think not.
What is happening here is that any velocity over about 45 mph the efficiency starts to suffer. This is because
at velocities higher than 45 mph, the projectile is traveling too fast to "catch" all the charge dumped by the second and
third stages, this extra charge possibly even slowing down the projectile. This doesn't happen in the single stage mode even at velocities greater than
45 mph because there are no other stages in operation.
So what does this mean? This means that it is time to adjust the timing or positioning of the second and third coils
relative to their respective optical triggering sensors.
Sensor/Coil Relative Position Optimization
The goal of optimizing the sensor/coil relative positioning is to get the highest
efficiencies and velocities as possible for a given operating voltage.
The thing that sucks about optimization is that for "optimal" performance, you need to optimize
the sensor/coil relative positioning for every friggin' voltage/velocity you use. Yeah, that
really sucks... So I picked a moderately high voltage where I knew that this gun could use some
work to go through the optimization process. First I accurately measured the distance between
the sensor and the coil. You don't need to know the actual distance from the sensor to
the coil because it is really arbitrary, but you need to be able to see how you have
changed the relative positioning. So I took some sticky
labels with a mark on them and placed one on the sensor and one near the center of the coil.
This allows me to accurately measure the distance between the two marks easily rather than
trying to guess where the actual center of the coil is because it doesn't really matter if it's
the center of the coil or the beginning or end.
Now that everything is totally clear, on with the optimization. Basically I just moved the coil
around relative to its respective sensor and recorded the resulting velocities and efficiencies.
If you don't have a way to measure projectile velocities, I really don't know how you'd do this.
So over to the right is the figure of the 2nd stage optimization for this system at 300 VDC.
From the figure you can see that a clear maximum occurs when the coil/sensor are in optimal
position relative to each other. When the distance between the coil and sensor is too short,
the coil is still energized after the projectile passes the center and the magnetic field begins
to suck the projectile backwards into the coil.
When the distance is too long, the magnetic field dissipates before the projectile can utilize
maximum energy.
According to the figure, the maximum efficiency occurs at a mark to mark distance of
1.07 inches. Again, this mark to mark distance is completely dependent on where I put the marks,
so what this does for you is...ABSOLUTELY NOTHING!
So by performing this optimization process, at 300 VDC this coil gun's efficiency improved
from 1.54 to 1.66 %. Now with this coil optimized, I'll move on and optimize stage number 3
at the same operating voltage.
Real-Time Measurement, Single Coil Study
 Real-time measurements utilize the DATAQ data acquisition device purchased on-line for $25. For this first figure, the device was run at its maximum rate of 240 samples per second recording only one channel. For this test only the first stage (coil) capacitor bank voltage was monitored, this stage being switched by relay, no SCR. The figure to the right shows the capacitor bank voltage as a function of time. One can see that for this test, the capacitor bank was charged to approximately 250 VDC and was held at that value until the coil gun was discharged near 0.705 seconds on the time axis. Upon firing, the capacitor bank voltage decreased sharply and plunged to more than 60 volts below ground and then approached a resting voltage of near ground. It is not yet clear to me why the voltage drops below ground, but it seems to be real. The firing relay was switched "on" near 0.705 seconds and remained "on" for the remainder of this figure.
This figure also shows that during the discharge from peak to peak, only four data points were collected, hardly enough to accurately map out the voltage/time profile. Analyzing two data points in the discharge period (points [0.704167,249.38] and [0.7125,19.951]) results in a 92% reduction of voltage in a time of 8.333 milliseconds. This result implies that if a 1.5 inch projectile were traveling at a speed of only 10 mph, it would travel its own length before the capacitor releases 92% of it's charge. This means that suck-back represents a HUGE problem and puts a limit on the maximum energy one can impart on a projectile. This measured discharge time was significantly longer (>4X longer) than the estimation of capacitor discharge through a resistor. This is at least partially due to the inductive action of the coil, limiting the rate of charge transfer.
Real-Time Measurement, Three Coil Study
 For this experiment the DATAQ device was run at maximum rate of 240 samples per second, while operating three channels. This means that for each channel the data-recording rate was 80 (240/3) samples per second. The figure to the right shows the capacitor bank voltage for each of the three stages as a function of time. The capacitor banks were charged in parallel to an approximate voltage of 275 VDC. At near 1.3 seconds, the coil gun was fired causing the capacitor voltages to again plummet below ground level. From the figure it appears that Coil 3 does not in fact dip below ground. I would like to point out that the "dots" or "markers" on the figure represent the actual data, not the line connecting the dots. I believe that Coil 3 most likely does dip below ground but the slow data recording rate did not capture this. Also it is clear that stages 2 & 3 do not follow the same profile of stage 1 after discharge. While stage 1 returns to an approximate voltage of zero, stages two and three approach a value of nearly 20 volts after only a few seconds (not shown in this figure). I am not sure why the voltage increases after discharge exactly, but the difference is that stage 1 is switched by relay while stages 2 & 3 are SCR controlled.
Also from the figure you can see a time distinction between the discharges of the three capacitor banks, but from this one cannot determine accurate projectile velocities. This rather just gives me a sense of assurance that everything seems to be operating properly. You can also see that Coil 3 seems to bump up a bit in voltage right before it begins to discharge. This feature seems to be present in most of the data I've collected so far but I'm not quite sure why it is there.
Some Qualitative Results
- 6/28/02 Test fire at 150 Joules projectile easily passes through a soda can.
- 7/2/02 Test fire at 175 Joules, projectile passes through one soup can wall and collides with shielding wall. We're not talking about a razor sharp nail puncturing a can here. This is a blunt steel rod passing through a soup can.
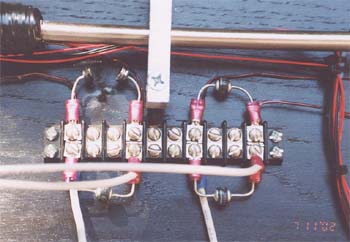
- 7/11/02 Additional 6 amp clamp diodes added for higher power testing. From what is left, it looks like I put one in backwards.
- 05/20/03 Uncovered for the summer and began 'greasing the wheels' today, high power testing to resume soon.
- 06/22/03 For a video of this gun blasting through a soup can, RIGHT click, choose save target as here.

Last updated: 07/20/03
Copyright 2003, Greg Miller
https://www.angelfire.com/80s/sixmhz/biggunresults.html