Title
Subtitle
Reference:
Vadim Chirkov
Figure
|
The symbols represent objects that located at points. On topographic maps, symbols represent towers, single trees, road pointers, etc. On thematic and small-scale base maps, symbols show size, significance or other characteristics of objects such as towns, administrative centres, factories, ore deposits, etc.
There are abstract and pictorial symbols, as well as letters used as cartographic symbols.
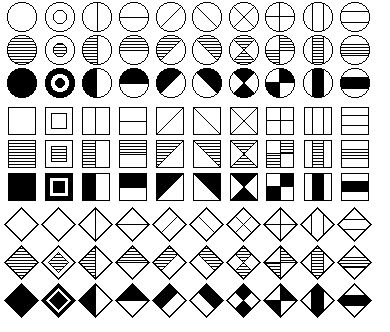
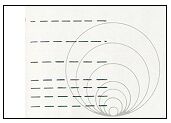
The abstract symbols have a form of simple geometrical figures such as square, triangle, circle, etc.
|
|
The abstract symbols can be easily drawn, recognised and compared in size. They take relatively little space in legends and on maps, and they show exactly the position of an object. Although there are limited number of elementary figures, one can increase the variety of symbols by use of different size, colour and internal structure.
|
Figure
|
Figure
|

Figure
|
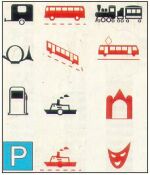
The pictorial symbols look like the objects they represent. (Figure) Pictorial symbols are less convenient for comparison and localisation of objects they represent, however, they are widely used on popular maps such as city maps (Figure) and posters, on which they may look out very naturalistic. Even without having any skills of reading maps, one can easily find a post office, a parking place, a tanking station, etc.

Figure
|
Figure
|
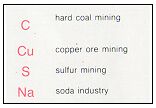
The letters when used as cartographic symbols mainly represent natural source deposits highlighting them on maps of industries. Usually this is one or two initial letters of the name of a chemical element, for instance W for wolfram and Al for aluminium. Use of letters is limited because they overload a map and do not indicate the exact location of an object. It is also difficult to compare their size because letters have different width, for example W and I, and there may be either one or two letters, for instance P and Fe. (Figure)
Figure
Figure
|
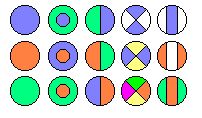
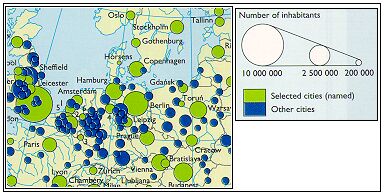
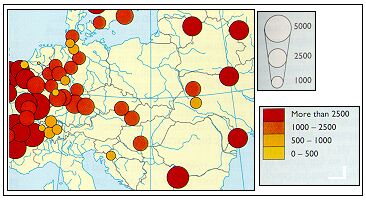
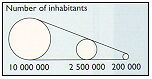
Form, colour and internal structure of a symbol express qualitative characteristics of features and phenomena. The size and in some cases the colour of a symbol express quantitative characteristics of features and phenomena. (Figure). The map (a) shows population of the cities in Europe. Circles of different colour and size depict the cities on the map. The qualitative characteristic (selected city - other city) is expressed by colour (green - blue), while the quantitative characteristic, the number of inhabitants, is expressed by size.
|

Figure

Figure

Figure
|

Figure
Figure
|
Figure
|

Figure
|
|
|
 Figure
|
Some bloody text
|

