
a. The German motor vehicle industry before the war, in contrast with the American automibile industry, which concentrated around Detroit, was widely dispersed. Important productive units were located in Russelheim, Brandenburg, Chemnitz, Cologne, Bremen, Hannover, Stuttgart, Gaggenau, Nurnberg, and Frankfurt. Thus there was no geographical concentration presenting a vulnerable target to an area attack, as was the case with steel industry (Exhibit A).
a. When Hitler came to power, the German motor vehicle industry was backward in relation to the rest of the German engineering industries and the importance of the country. From that time onward the government stimulated expansion of the industry in the following ways:
(1) Through the construction of the Reichsautobahnen, a system of national trunk roads.
(2) Through the birth and propagandizing of the Volkswagen (Peoples' Car) idea, which was to bring a low-priced government-sponsored motor car within the reach of the average German pocket book.
(3) Through a program of standardization of types.
(4) Through cancellation of the previously high annual tax on new passenger cars, motorcycles, and trailers after April 1933, as was as through reduction of insurance and other costs.
b. As a result of this encouragement, there was a rapid increase in German motor vehicle production. The curtailment of peace-time output at the beginning of the war left the industry with much excess capacity as well as modern mass-production facilities which were readily adaptable to the manufacture of many war products. However, this potential capacity was not immediately utilitized.
c. With the exception of the government-owned
Volkswagen plant in Fallersleben, this build-up of the industry was effected by encouraging the private automobile manufacturers to combine and expand.
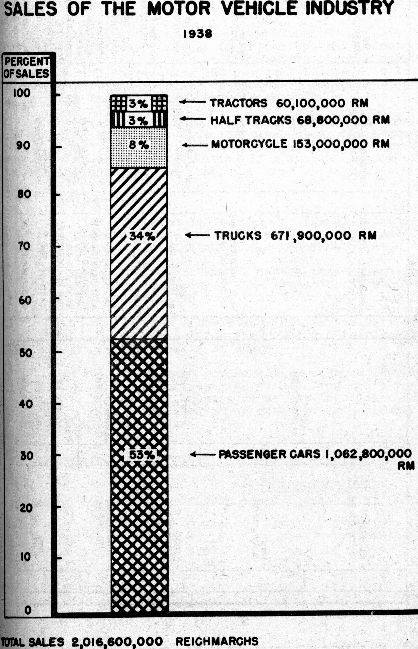
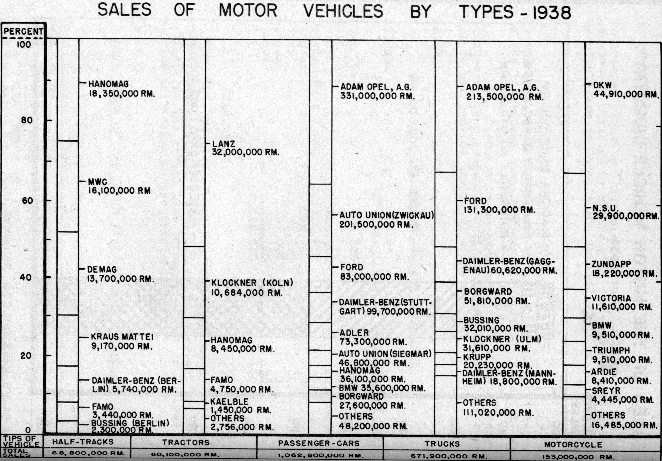
a. Figures 1 and 2 show both total sales for 1938 by the motor vehicle industry of major products and sales by individual companies contributing to the total.
b. Although there were more than 35 motor vehicle producers, four companies dominated the industry and accounted for 64 percent of the total sales.
Table 1
Breakdown of Total Sales-1938
1000's of RM
| Company | Sales | Percent of Total |
|---|---|---|
| Adam Opel | 604,500 | 30.0 |
| Auto Union | 293,210 | 14.5 |
| Ford | 214,300 | 10.7 |
| Daimler-Benz | 184,860 | 9.2 |
| Borgward | 79,410 | 3.9 |
| Adler | 73,300 | 3.6 |
| Hanomag | 62,900 | 3.1 |
| Others | 504,120 | 25.0 |
a. Total production of the three major units of motor vehicle output, trucks, passenger cars, and motorcycles, for the period 1934 through 1939 is as follows (including deliveries to the armed forces).
Table 2
Production of the Motor Vehicle Industry 1934-1939
| Year | Trucks | % of 1934 | Passenger Cars | % of 1934 | Motorcycles | % of 1934 |
|---|---|---|---|---|---|---|
| 1934 | 28,452 | 100 | 144,542 | 100 | 74,481 | 100 |
| 1935 | 45,213 | 159 | 205,233 | 142 | 115,020 | 154 |
| 1936 | 70,040 | 246 | 240,530 | 166 | 140,844 | 189 |
| 1937 | 79,16 | 274 | 267,910 | 185 | 171,239 | 230 |
| 1938 | 87,661 | 308 | 289,108 | 200 | 199,299 | 268 |
| 1939 | 101,745 | 363 | 250,788 | 174 | 204,115 | 276 |
The rapid and steady increase in the motor vehicle output, finally interrupted in 1939 by the war, is clearly shown. Over the period there was a 263 percent increase in truck output, 74 percent increase in passenger car output, and 176 percent increase in motorcycle output.
b. Production in 1938 and 1939 was limited by the size of steel allotments from the government. Consequently, Table 2 is not an exact indication of what could have been produced with existing facilities if a greater supply of raw materials had been available to this industry.
a. The following table analyzes the distribution of trucks, passenger cars and motorcycles to the armed forces, civilian sector, and export and shows two major items:
(1) The proportion of passenger cars and motorcycles going to the armed forces was very small. On the other hand, the number of trucks going to the armed forces increased rapidly in 1938 and 1939 as the German army mechanized for war, taking 32 percent of total sales in 1939.
(2)The German government encouraged export sales of the motor vehicles by granting extra raw material quotas as well as subsidies to equalize currency exchange rates (Exhibit G).
Table 3
Distribution of Motor Vehicles 1934 - 1939
| Trucks | Passenger Cars | Motorcyles | |||||||
|---|---|---|---|---|---|---|---|---|---|
| Year | Armed Forces | Civ | Export | Armed Forces | Civ | Export | Armed Forces | Civ | Export |
| 1934 | 1,764 | 24,440 | 2,248 | 3,903 | 129,510 | 11,130 | 3,139 | 7,3144 | 2,197 |
| 1935 | 7,053 | 34,045 | 4,114 | 9,235 | 175,885 | 20,113 | 6,096 | 103,518 | 5,406 |
| 1936 | 7,284 | 56,102 | 6,654 | 9,381 | 201,324 | 29,826 | 7,183 | 122,112 | 11,549 |
| 1937 | 12,739 | 52,302 | 14,084 | 5,626 | 204,415 | 57,869 | 9,418 | 138,704 | 23,117 |
| 1938 | 22,792 | 51,106 | 13,763 | 13,588 | 211,338 | 64,182 | 14,395 | 151,146 | 34,388 |
| 1939 | 32,558 | 52,907 | 16,279 | 20,063 | 167,276 | 63,449 | 28,576 | 141,860 | 33,679 |
| Total | 84,172 | 270,902 | 57,142 | 61,796 | 1,089,748 | 246,569 | 68,807 | 730,484 | 110,336 |
a. In 1939, the industry had 173,000 employees of which [illegible] German men and 14,000 German women.
a. Relative size and importance in the German economy as a whole is shown in the following table comparing sales of the motor vehicle industry with other comparative industries:
Table 4
Sales of Various German Industries - 1939
In Million RM
| Motor Vehicles | 2,017.2 |
| Pit-coal Mining | 2,173.9 |
| Coke Production | 702.8 |
| Raw Iron Production | 1,093.3 |
| Steel Production | 1,936.0 |
| Cement | 368.1 |
1. Apparently the main reason for the major expansion program of the German automotive industry from 1934 to 1939 was not to build up manufacturing facilities that could easily be adapted to war purposes, but rather to increase production of a civilian commodity which was one of the basic items of a high living standard as well as a profitable
export item. Obviously an expansion of the industry for mass production of automobiles and other vehicles would employ a large number of people, lower costs to the point where a greater number of people could affort to own an automobile, and in general, strengthen the German economy. In addition, motor vehicle exports were one of the major sources of foreign exchange credits and accordingly the government subsidized export sales. The following sections give some of the facts upon which the above conclusion is based.
a. No evidence was discovered of a systemic plan for converting the industry to war production. Actually most of the productive facilities were not utilized even their prewar extent until 1942 or 1943, and then their excess capacity was converted chiefly to production of components for the aircraft and tank industries. Thus, the first and third largest automobile producers in Germany, Adam Opel at Russelheim and Daimler-Benz, at Unterturkheim, after 1942 became to an increasing extent sub-contractors for the aircraft industry as the aircraft industry expanded to offset the effects of Allied strategic bombing. While the second largest automobile factory, Auto Union, Zwickau, remained a motor vehicle producer throughout the war, it wasn't until April 1943 that the plant was utilized completely by converted from the production of light armored cars to three-ton half-tracks.
b. The Volkswagen plant in Fallersleben was another example of non-utilization of motor vehicle facilities. This plant, finished in 1939, was the largest factory of the type in Germany, had the largest press shop in Europe, and was capable of producing in excess of 150,000 cars per year. According to the management, however, the start of the was found the plant's management as well as the authorities in Berlin unprepared for utilization of the plant in the war effort. The German government expected a short war and accordingly remained virtually idle, its 1941 production representing only 20-25 percent of the plant's capabilities. During the entire course of the war the plant never produced more than 50 percent of its capacity.
c. Production in 1938 and 1939 was largely limited by the amount of raw material allowed the industry by the Four Year Plan. This partly checked the expansion program.
d. The fact that the German Army even in 1944 used a large proportion of standard civilian trucks, in contrast to the American Army, which required principally
all-wheel drive military trucks, is a further indication that the German government did not fully mobilize the motor vehicle industry, but rather planned to keep it intact to the greatest extent possible in order to reconvert easily to peace time production.
e. Both Dr. von Heydekampf, head of the Main Committee for Motor Vehicles, Tanks and Locomotives, and Mr. Vorwig, manager of the Committee for Motor Vehicles, expressed the opinion that the automotive industry was not utilized during the war to anywhere near the extent possible, and that if a comphrensive program for conversion had existed at the beginning of the war the industry's contribution to the war economy would have been much greater.
f. While Adam Opel - Brandenburg represented a necessary expansion in 1935 on the part of Adam Opel AG in order to maintain its position in the industry, the fact that the government required the company to expand east of the Elbe, 200 miles from the main plant at Russelheim, represented an attempt to move important truck facilities to the less vulnerable sections of western Europe. It was part of the general government policy at that time that expansion of vital industries should take place, whenever possible, east of the so-called "Hannover Line" and enforced through government control of machine tool purchases, building supplies, etc. This policy, however, was the only indication of planning in anticipation of war that affected the motor vehicle industry.
a. The problem of the industry during the period 1940 through 1942 was to find adequate utilization of its productive capacities. Motorcycle and automobile production tapered off considerably as civilian production was stopped, while truck production did not exceed 80 percent of the 1939 volume. The following table gives the annual value of the vehicles produced by the industry from 1938 through 1941. Similiar figures are not available for 1942.
Table 5
Value of Produced Vehicles 1938-1941
| Year | Total (RM) | % of 1938 | % of Drop from 1938 |
|---|---|---|---|
| 1938 | 1,390,000,000 | 100 | - |
| 1939 | 1,380,000,000 | 99.9 | 0.1 |
| 1940 | 820,000,000 | 59 | 41 |
| 1941 | 720,000,000 | 52 | 48 |
While it is not known just what percent of the motor vehicle industry capacity had been converted to the manufacture of other products by the end of 1941, it is known that total conversion during the war amounted only to 33 percent and that most of it occured to 1942 and 1943.
a. In 1943 the German Army greatly increased production schedules because of heavy losses on the Russian Front. This increase was chiefly in special vehicles such as the "Mule" (trucks with half-track replacing the rear wheels), and the full caterpillar trucks (RSO), which experience with the Russian terrain and climate made necessary. Accordingly the final production schedule for 1943 called for 136,743 trucks as compared with 81,279 trucks actually produced in 1942, or an increase of almost 70 percent. Of this number, 27,486 were to be ""RSOs" and "Mules".
a. Production of the major items of output for this period were as follows (Exhibits C and D):
Table 6
Production of Motor Vehicles 1940 Through 1943
(Greater Germany, including Austria and Western Czechoslovakia)
| Product | 1940 | 1941 | 1942 | 1943 | Total | |
|---|---|---|---|---|---|---|
| Automobiles | 67,561 | 35,165 | 27,895 | 32,238 | 162,859 | |
| Motorcycles | 116,081 | 74,167 | 53,083 | 33,733 | 277,064 | |
| Trucks | Up to & incl 1.5-ton | 6,912 | 9,504 | 14,436 | 21,666 | 52,518 |
| 3-ton | 50,345 | 43,800 | 51,804 | 48,877 | 194,426 | |
| 4.5-ton & up | 6,039 | 9,096 | 11,952 | 11,567 | 38,627 | |
| Caterpillar Truck (RSO) | 0 | 0 | 1,452 | 14,010 | 15,462 | |
| 3-ton Mule | 0 | 0 | 1,635 | 12,771 | 14,406 | |
| 4.5-ton Mule | 0 | 0 | 0 | 594 | 594 | |
| Total Trucks | 63,296 | 62,400 | 81,279 | 109,085 | 316,033 | |
| Half-tracks and Special Vehicles | 6,435 | 8,821 | 10,733 | 17,535 | 43,524 | |
| Motorcycle Half-tracks | 0 | 420 | 985 | 2,450 | 3,855 | |
| Tractors | Not available | 3,097 | 3,097 | |||
7
Production figures for Ford, Cologne, include the entire Ford complex.
b. Production of trucks in 1943 amounted to 109,085 of all standard types, but represented a failure to meet planned production by 27,360 trucks (20 percent). This failure was not the result of bombing attacks on the industry, because there were no precision plant attacks during 1943; it was principally due to a combination of the following factors:
(1) Component production wasn't expanded enough to allow the final assemblers to produce at the level required by schedules.
(2) Machine tools, jigs, tools, and fixtures necessary for the simultaneous conversion to so many new items were not made available fast enough.
(3) The total labor force decreased 12 percent. This included a 31 percent decrease in German male labor.
c. In addition to its own war production, Germany was able to call upon the production of occupied countries. The full utilization by the Army of this production, since in general the vehicles produced consisted of non-standard types, was hindered by the difficulties in obtaining and storing spare parts. Complete statistics are not available on the quantities thus made available to Germany; what is known is summarized in Exhibit E. Production in 1943 for France and the Czecho-
slovakian Protectorate amounted to 11,735 trucks. This was an addition to German truck production which amounted to 10 percent of the total.
a. Distribution of trucks, automobiles and motorcycles for the armed forces, civilian economy and exportation during this period is shown in the following table (Exhibit E):
Table 7
Distribution of Motor Vehicles 1940-1943
| Trucks | Automobiles | Motorcyles | |||||||
|---|---|---|---|---|---|---|---|---|---|
| Year | Armed Forces | Civ | Export | Armed Forces | Civ | Export | Armed Forces | Civ | Export |
| 1940 | 38,420 | 15,571 | 9,305 | 28,510 | 26,011 | 13,040 | 54,442 | 48,173 | 13,466 |
| 1941 | 37,003 | 15,725 | 9,672 | 27,077 | 3,200 | 4,888 | 41,979 | 23,585 | 8,603 |
| 1942 | 59,463 | 16,577 | 5,239 | 24,353 | 1,283 | 2,259 | 33,283 | 9,820 | 9,980 |
| 1943 | 92,580 | 12,992 | 3,513 | 30,594 | 935 | 709 | 27,830 | 3,879 | 2,024 |
| Total | 227,466 | 60,865 | 27,729 | 110,534 | 31,429 | 20,896 | 157,534 | 85,457 | 34,073 |
a. There was very little building expansion within the automobile industry during the war. Instead a sizeable portion of German motor vehicle production facilities was converted to the production of other war material. The following table lists the more important plants thus converted, together with the date, and the industry to which they were transferred:
Table 8
Conversion of Motor Vehicle Plants 1939 - 1943
| Plant | Location | Date of Conversion | *% Converted | New Product |
|---|---|---|---|---|
| Motorcycle Plants | ||||
| Ardie-Werke | Nurnberg | 1942 | 100 | |
| Auto-Union | Zschopau | 1940 | 50 | Stationary Motors |
| Bayerische Motor Werke | Munich | 1943 | 100 | Aircraft Motors |
| Steyr-Daimler-Puch | Steyr | 1943 | 100 | Tank components |
| Triumph Werke | Nurnberg | 1942 | 70 | |
| Victoria Werke | Nurnberg | 1942 | 80 | |
| Passenger Car Plants | ||||
| Bayerische Motor Werke | Eisenach (2 plants) | 1940 | 100 | Arms & Aircraft Motors |
| Daimler-Benz | Unterturkheim | 1940 | 90 | Aircraft & Marine engines |
| Maybach Motorenbau | Friedrichshafen | 1940 | 100 | Tank engines |
| Adam Opel | Russelsheim | 1940 | 80 | Aircraft components |
| Truck Plants | ||||
| Frame Werke | Hainschen | 1943 | 100 | Arms |
| Henschel & Sohn | Kassel | 1943 | 100 | Tanks |
| O.D. Werke Willy Ostner | Brand-Erbendorf | 1942 | 100 | Arms |
| Vomag Maschinenfabrik | Plauen | 1942 | 100 | Tanks |
| Tractor Plants | ||||
| Lanz | Mannheim | 1943 | 100 | Tanks |
| Half-track Plants | ||||
| Daimler-Benz | Marienfelde | 1943 | 100 | Tanks |
* Several of these plants were not primarly motor vehicle producers before the war. However, that part of their production represented by prewar motor vehicle output lost by conversion to other war material is shown above.
Accordingly, the greater protion of the prewar German motorcycle and passenger car facilities were transferred to the production of either tanks, arms or aircraft components as shown in the above table, or to other types of motor vehicle production as was the case with Auto-Union - Zwickau, which converted from cars to trucks. Transfer of truck production capacity was limited, and generally took place only when the tank expansion program crowded out vehicle production at plants which had previously produced both trucks and tanks.
a. As early as 1939, a standardization program had been started by General von Schell, at that time chief of Wehrmacht motorization. The war brought about the completion of this program with the result that production of a great many models was terminated and production of standard models substituted in their place. One standard type was produced in a given factory, thus increasing efficiency in a mass production process. The following table gives the number of types of vehicles in the various classes before and after this "Schell" program as taken from the Motor Vehicle Ministry's records:
Table 9
Standardization of Types of Vehicles
| Type | Number of Types | Percent of initial # | |
|---|---|---|---|
| 1939 | 1942 | ||
| Motorcycles | 150 | 26 | 17 |
| Passenger Cars | 55 | 29 | 53 |
| Trucks | 131 | 23 | 18 |
| Passenger car trailers | 658 | 3 | 0.5 |
| Truck trailers | 1,367 | 8 | 0.7 |
a. It was not until April 1943 that the German motor vehicle industry first began considering the question of dispersal of big factories. The authorities then realized that the industry, with so great a concentration of productive facilities in a few factories, offered the Allies a vulnerable target for systematic air attacks. Although a small amount of dispersal of the larger factories began in May 1943, the fact that automobiles factories had not been bombed apparently lulled the manufactures into a sense of false security, for very little actual dispersal was effected before the bombing offensive against truck factories started in July 1944.
a. Air Raid Shelters During the early stages of the war, air raid shelters were mostly makeshift affairs installed in the basements of buildings. The ceilings and walls were reinforced with timber bracing and gas-proof doors were installed. Slit
trenches were dug but were confined for the most part within the areas of worker's battacks.
b. Camouflage All buildings in the larger plants were camouflaged with paint and netting, with netting also used to conceal sky-lights, roadways and passages between the buildings. A small number of flat deck roofs were planted with grass. Small plants were camouflaged only with paint. At Daimler-Benz, Unterturkheim, three nearby identification points, a water-filled gravel pit, a stadium and a chapel, were covered with netting and planted with simulated trees. The first smoke screen for concealing an industrial plant was installed at Daimler-Benz, Sindelfingen. A sulphurous acid agent was employed. Plant officials gave this smoke screen credit for the very small damage inflicted in the course of three raids. On 10 and 13 September 1944, however, the gas supply had run out and Eighth Air Force attacks on these dates destroyed 80 percent of the plant. A smoke screen was also installed at Daimler-Benz, Unterturkheim, but since the chemical reaction depended on the amount of moisture in the air, it was not always effective. The major attack on this target came on a dry, clear day and visibility was not obscured by the smoke screen.
a. By 1 January 1944, the German truck situation had already become critical on account of losses in Russia, North Africa and Italy. Maximum production of the German truck factories had been calculated at slightly over 167,000, but no attempt had yet been made to produce at such a rate. However, the production schedules of 9 November 1943 finally called for maximum effort, 167,440 trucks. Planned half-track production was at approximately the same level as in 1943. Automobile and motorcycle production schedules were small, at a rate only 20 percent of prewar production; they are of little importance in the total picture.
a. Production of the major items of output for 1944 are shown in the following table (Exhibits C and D):
Table 10
Production of Motor Vehicles 1944
| Product | Quantity | |
|---|---|---|
| Trucks | up to & incl. 1.5 ton | 22,383 |
| 3-ton (incl "Mules") | 43,052 | |
| 4.5-ton & up (incl "Mules") | 10,771 | |
| Caterpillar truck (RSO) | 11,942 | |
| Total | 88,088 | |
| Half-track and special vehicles | 17,736 | |
| Automobiles | 21,656 | |
| Motorcycles | 30,372 | |
| Motorcycle half-tracks | 4,490 | |
| Tractors | 1,013 | |
b. Although during the first six months of 1944 there were very few direct interruptions to truck production due to bombing, output amounted to only 53,949 trucks, which was almost exactly the same rate as in 1943. It was the consensus of opinion among plant and government officials that the component manufacturers at this time were not able to expand at the necessary rate. There were shortages in forgings, castings, crankshafts, steering gears, etc. which prevented realization of the attempted expansion. The only plant heavily bombed during this period was Steyr AG, Austria, which as a result of three heavy raids in February and March, suffered a loss of over 3,000 trucks from February through June 1944. Adding this loss to the actual production figures gives an estimate of about 57,000 as the highest production that could have been reached in the first six months of 1944 in the absence of any bombing of truck plants, or a monthly average of 9,500 trucks. The U.S. during 1944 produced 595,440 Army trucks.
a. In general, the only motor vehicle plants selected for heavy attacks by the air forces were the ones producing medium and heavy trucks (three tons and up), since these types of trucks were the backbone of the German Army transportation system. The 1.5-ton German truck was the equivalent of our 3/4-ton American model (the Germans included the load in the weight) and thus of little importance in transporting large quantities of supplies or numbers of troops. The German
3-ton truck was equivalent to the American 1 1/2-ton truck. The following table lists plants producing medium and heavy trucks (Exhibit B):
Table 11
Manufacturers of Medium and Heavy Trucks 1944-1945
| Type | Manufacturer | Location |
|---|---|---|
| 3-ton (Medium) | Adam Opel | Brandenburg |
| Ford | Cologne & other assembly plants | |
| Daimler-Benz | Mannheim | |
| Borgward | Bremen | |
| 4.5-ton & over (Heavy) | Bussing NAG | Brunswick |
| Daimler-Benz | Gaggenau | |
| Saurer | Vienna, Austria | |
| 3 small producers | ||
Three plants from the above 11, Opel, Ford, and Daimler-Benz, Gaggenau accounted for 78 percent of medium and heavy truck production. This concentration of the truck industry in these three plants made the industry a very vulnerable target to air attack.
a. The following table measures the loss of all types of trucks by month from July, 1944 when truck plants were first systematically attacked, through February 1945, by comparing actual production with average production based on the first six months of 1944.
Table 12
Comparison of Actual Monthly Truck Production
July 1944 Through February 1945 with Pre-July Average
| Year | Month | Total Production | Loss | Gain |
|---|---|---|---|---|
| 1944 | Pre-July Average | 9,500** | ||
| July | 9,572 | 72 | ||
| August | 6,976 | 2,524 | ||
| September | 5,302 | 4,198 | ||
| October | 4,630 | 4,870 | ||
| November | 4,366 | 5,134 | ||
| December | 3,193 | 6,307 | ||
| 1945 | January | 2,879 | 6,621 | |
| February | 2,458 | 7,042 | ||
| Total | 39,376 | 36,634 (Net Loss) | ||
** Includes 3,000 trucks lost in Austria
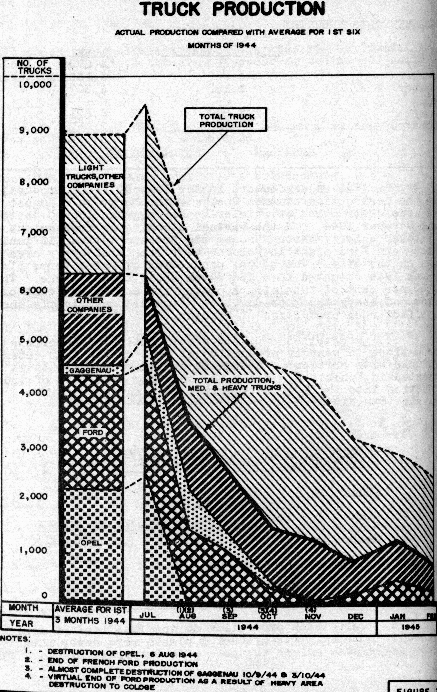
14b. The major factors in the loss of truck production were the destruction of Adam Opel, Brandenburg, on 6 August, the destruction of Daimler-Benz, Gaggenau, on 10 September and 3 October 1944, and the virtual stopping of Ford output in October chiefly through power and transportation difficulties at the main Ford plant in Cologne as a result of heavy area raids on the city. The actual production of these three plants in June 1944 amounted to 4,966 3-ton and 4.5-ton trucks. This was 53 percent of total truck production and 78 percent of medium and heavy truck production. Figure 3 graphically shows the effect on production of bombing these plants.
c. A detailed analysis of production loss correlating fluctuation in monthly production of each of the four categories of trucks with particular incidents at individual plants is represented in Exhibit F. Table 13, breaking down loss of truck production into the four categories, is a summary of this analysis (Exhibit H).
Table 13
Loss of Truck Production by Types
July 1944 Through February 1945
| Types | Loss |
|---|---|
| Light | 3,229 |
| Medium | 29,078 |
| Heavy | 2,854 |
| RSO | 1,463 |
| Total | 36,624 |
d. Half-track production during 1944 was not seriously affected by bombing. Its producing plants were never attacks as a target system as was the case with the truck plants. The
only two heavily hit half-track plants were Karl Borgward, Bremen, which was bombed as a truck factory in August and September 1944, and Adler, Frankfurt, which was hit by five area raids. As a result of these slight bombing effort against half-tracks, 1944 production was slightly greater than 1943 production.
a. Up to October or November 1944 production losses at motor vehicle plans, with the exception of Ford, were almost entirely attributable to the direct results of raids on the plants and to alerts. With the exception of absenteeism caused by area raids on worker's homes, the indirect effects of bombing other industries and communications and the destruction of raw materials and components influenced the output of finished products to only a minor degree. The more important causes of losses within the plant were:
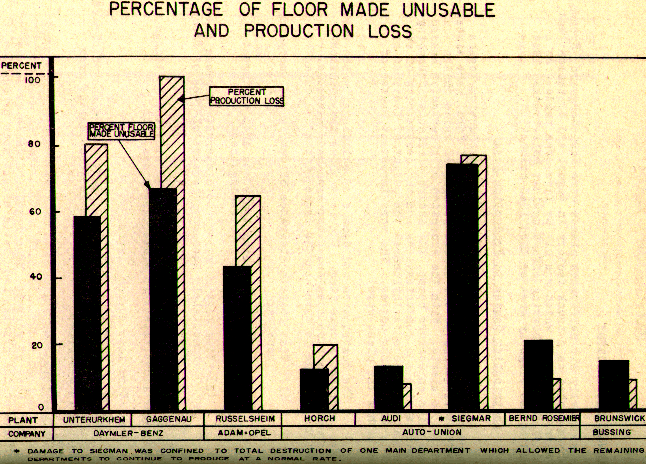
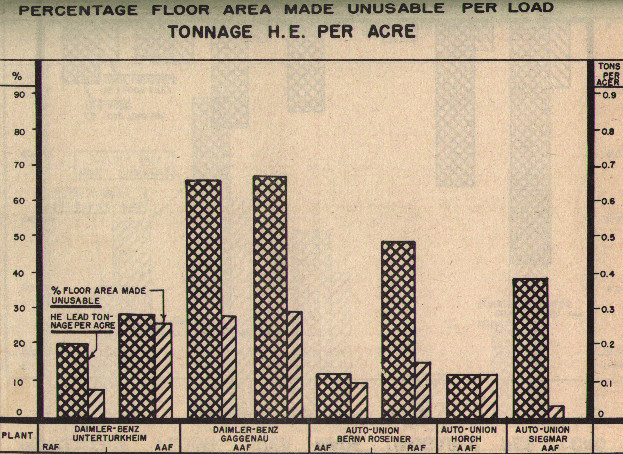
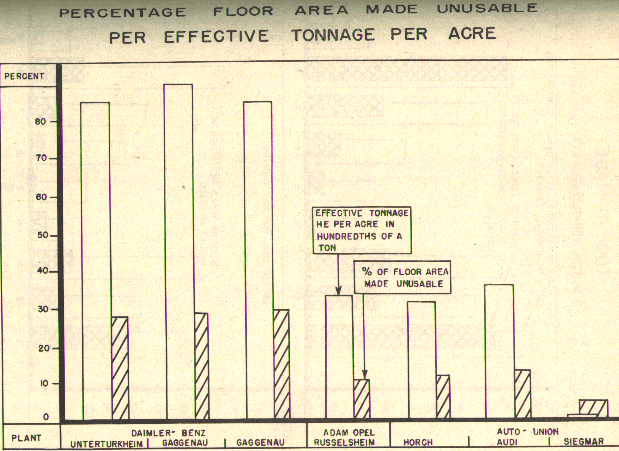
b. The destruction and damage of buildings, which was the most important single item. Figure 4 shows the relationship between production loss and floor area made unusuable. The building damage in turn was the cause of the following:
(1) Time lost in clearance of debris and emergency repairs.
(2) Damage to machine tools and shop equipment and time lost in cleaning them.
(3) Time lost carrying out dispersal programs made immediately necessary because of loss of floor space.
c. The disruption of utilities outside the buildings, such as water lines, electric lines, gas pipes, etc.
d. Time lost during alerts.
e. Machine tool and shop equipment damage caused directly by bomb hits, as distinguished from indirect damage from falling debris and fire.
a. Loss of workmen, as a result of death or injury in air attacks on the plants, had little effect upon production. In seven factories with a total employment of 61,834, less than two percent were killed (495) and injured (528) in raids. Since the plants on which this percentage is based were the
more heavily hit ones, it is probable that casualties over the entire industry would run somewhat less than one percent.
a. As mentioned in Section III, dispersal before the bombing offensive against the truck factories had taken place on a very minor scale and offered the plants very little possibility for quick recuperation after raids. Since new construction was practically impossible and materials for repairs very scarce, the attacks on plants quite often left the plant managers with no alternative except to disperse undamaged machines to any possible site regardless of working conditions, power facilities, etc. Most of the desireable sites had been secured by other industries before the motor vehicle producers made any major efforts to disperse. As a result of the difficulties involved in getting ready for production in an inconvenient location, many of these dispersal sites either never produced or required six to eight months to start production. Of four automobile factories surveyed which had suffered over 60 percent damage to buildings, only one, Daimler-Benz, Unterturkheim, was able to use dispersal to accomplish effective recuperation. This was due to the foresight of the plant officials in setting dispersal plants in advance of raids. The other three made no arrangements for dispersal before the raids and therefore failed in their attempt to resume production from hastily chosen dispersal sites.
a. OKW records show a total of 109,113 trucks lost at the fronts from January through August 1944. This was the entire production of 1943 and represented 39 percent of the entire military stock at that time. Half-track losses from January through August 1944 amounted to 7,790, a figure considerably less than the production for the same period and accordingly easily replaced.
a. Early in 1944, orders were issued for the construction of baffle walls throughout all war plants for the protection of important machine tools, assembly lines, transformer stations and sub-stations and other critical facilities. Only a limited amount of this work was completed, however, because of the inability of the plants to obtain the necessary materials, mainly bricks. Only such critical items such as electric power distribution
panels and special machines which were hard to replace were finally protected.
b. During the first half of 1944, air raid shelters at practically all plants were made more secure and were enlarged to shelter foreign workers as well as German workers. In many cases, new shelters were provided, either by the construction of massive concrete bunkers, by digging new tunnels in nearby hillsides or altering existing tunnels. The original bunkers consisting of reinforced basement shelters were, for the most part, abandoned because it was found that the elder type would not stand up under heavy bombing. Undoubtedly many of the workers' lives were saved as a result of this program.
a. There was very little conversion of motor vehicle productive facilities to the production of other war products during 1944 and 1945. With the exception of Auto-Union, Siegmar, all large plants listed in the following table devoted only a small proportion of their facilities to motor vehicle production and this they eliminated in oprder to expand their major production items.
Table 14
Conversion of Motor Vehicle Capacity 1944-1945
| Plant | Location | Formerly Produced | Transferred to |
|---|---|---|---|
| Daimler-Benz | Unterturkheim | 1.5-ton trucks | Aircraft motors |
| Auto-Union | Siegmar | RSOs | Tank engines |
| Skoda | Prague | Tractors | Tanks |
| Miag | Brunswick | Tractors | Tanks |
| Lanz | Mannheim | Tractors | Tank transmissions |
| NSU | Neckarsulm | Motorcycles | Arms |
| MAN | Nurnberg | 4.5-ton trucks | Tanks |
| Henschel & Sohn | Kassel | Omnibuses & Trucks | Tanks |
| BMW | Munich | Motorcycles | Aircraft motors |
| Zundapp | Stuttgart | Motorcycles | Arms |
b. An expansion of the heavy truck program was attempted in Vienna by utilizing Austrian production facilities until then idle. The three Vienna plants of Fross-Bussing, GAF and Saurer were combined in August 1944 as the Gemeinschaft Wiener Automobilfabriken and were to become by December 1944
the largest producer of 4.5-ton trucks, at a montly rate of 450. This program was slow in getting started, however, and montly production never exceeded 160.
a. In 1944 many more types of motor vehicles fell victim to the standardization program, with the result that of the standard models only two motorcycles, one car and nine trucks were still being produced in the last quarter of the year. The only manufacturer of motorcycles was Auto-Union, producing both 125cc and 350cm, while the only car (jeep) manufacturer was Volkswagen. The following are the trucks which were still part of the war program at that time; they include only one type strictly intended for civilian use:
(1) .65-ton tricycle truck by Vidal and Son. Purpose: inter-city traffic; powered with low-pressure charcoal gas.
(2) 1.5-ton Steyr 4-wheel drive truck with air-cooled, 8 cylinder gasoline V-engine; latest model with 2-ton loading capacity and 13-place body; produced by Steyr and Auto-Union.
(3) 1.5-ton Phanomen with 4-wheel drive and 4 cylinder, air-cooled gasoline engine. Used exclusively as an ambulance.
(4) 3-ton Opel with either all-wheel drive or rear-wheel drive only and inter-cooled, 6-cylinder gasoline engine. Produced by Opel and Daimler-Benz.
(5) 3-ton Ford with rear-wheel drive and either water-cooled 8 cylinder gasoline V-engine, or water-cooled 4 cylinder engine.
(6) 3-ton Borgward with either all-wheel drive or rear-wheel drive only and water-cooled, 6 cylinder diesel engine.
(7) 4.5-ton Daimler-Benz with either all-wheel drive or rear-wheel drive and water-cooled 6 cylinder diesel engine. Produced at Gaggenau and Vienna.
(8) 4.5-ton Bussing with either all-wheel drive or rear-wheel drive and air-cooled 6 cylinder diesel engine.
(9) 8-ton Tatra 3-axel all-wheel drive and air-cooled, 12 cylinder diesel engine.
In addition to these types, based on the peacetime production models, the following special army types were produced:
Special Vehicles
(1) Motorcycle half-track ("Kettenrad") with 4 cylinder water-cooled Opel Olympic engine.
(2) "Springer" demolition charge carrier based on the "Kettenrad"; same engine as the "Kettenrad".
(3) "Goliath" demolition charge carrier with 2 cylinder air-cooled Zundapp engine.
(4) "RSO" caterpillar tractor for the Eastern Front with 4 cylinder air-cooled Klockner-Humboldt-Deutz engine.
(5) 8-wheel armored car with air-cooled 12 cylinder Tatra diesel engine.
Half-tracks
(1) 1-ton as an armored scout car.
(2) 3-ton as an armored troop carrier.
(3) 5-ton "SWS".
(4) 8-ton.
(5) 12-ton.
(6) 18-ton.
(These half-tracks were equipped with water-cooled Maybach gasoline engines)
b. Obviously this standardization program necessitated conversion of productive facilities within the industry from one project to another. The following are the changes made within the industry:
Table 15
Conversion of Motor Vehicle Plants 1944
| Plant | Formerly Produced | Changed to |
|---|---|---|
| Tatra | Passenger cars | 6.5-ton trucks |
| Stoewer | Motorcycles | Motorcyle half-tracks |
| Klockner | 3-ton trucks | RSOs |
| Steyr | RSOs and Motorcycles | 1.5-ton trucks |
a. The entire motor vehicle production was for the armed forces, and other organizations had to ask the armed forces for any vehicles required. Non-military organziations naturally received very small quantities, and these were only the models unsuitable for Army purposes, for example obsolete trucks. Not only did the armed forces take almost all new production and allocate less than 3 percent of new trucks to civilian use in 1944, but many private vehicles were commandeered by the Army in the last year of the war to compensate for the loss in production and losses on the fronts. It was estimated by the Speer Ministry that at the end of the war German private economy had only 160,000 motor vehicles in operation, as compared to almost 3,000,000 at the beginning of the war. This was due both to the Army's taking over private vehicles and to a shortage of spare parts and fuel.
a. It is probable that in the last year of the war, the German government made the mistake of concentrating on the production of finished vehicles, with the result that the number of vehicles deadlined on account of scarcity of parts was very large. This opinion was expressed by many German generals and Speer officials and was due to the destruction of large quantities of spare parts both at motor vehicle plants and at repair and parts depots behind the fronts. The spare parts storage facilities at motor vehicle plants were especially vulnerable to air attacks because of the presence of large amounts of combustible packing material in the same buildings, and the fact that in most factories the spare parts departments were housed in the old-style of buildings. This resulted in the destruction of the greater portion of the spare parts in storage at the plants, and in the case of Adam Opel, Henchel & Sohn
and Daimler-Benz, the almost complete destruction of these departments. In spite of the disastrous effect this loss was bound to have on repair of trucks in the field, no effort was expended afterwards to replace these parts. Factories preferred to neglect production of substitute parts in favor of new production because the substitute parts didn't show up in their production figures of vehicles.
a. The training of labor was evidently left to each plant. The extensive prewar apprentice-school system was practically abandoned during the war. Taking its place was the major task of quickly training the foreign civilian workers and prisoners. These workers amounted to 50 percent of the total labor force in 1944. Of the foreign workers, an average of only 10 to 20 percent could be classified as having previously acquired skill for the work they were called upon later to perform. Apparently the government had evolved no uniform or general plan for training either the German or foreign shop personnel. No school system was employed and all training was actually done in the shops themselves.
a. When the amount of gasoline and oil was cut down by the bombing offensive against the oil industry, economies were instituted to save as much fuel as possible. Some was saved by the use of trailers. When a shortage of trailers appeared, trucks were joined together as tractors and trucks. By economies such as this, savings of fuel up to 50 percent were effected.
b. Up to mid-1944, only 3,000 to 4,000 vehicles were converted monthly to substitute fuels. The increasing bombing of synthetic oil plants caused the rate of conversion to be stepped up, but the effectiveness of such a conversion program was hindered by scarcity of conversion units and, to a large extent, by the amount of work entailed in installation. The minimum time needed to install a truck generator was 300 hours.
c. Finally, it was decided to use as much diesel fule as possible since it was easier to produce than gasoline. As early as 1 July 1944, Klockern-Humboldt-Deutz, Ulm, received orders from the Main Committee to increase its production facilities for diesel motors to the point where it could produce diesel motors for all RSOs, in addition to 2,000 to 3,000 per
month to replace gasoline motors in other types of trucks. In late 1944, German technical experts were developing diesel motors that could be used in all trucks and half-tracks.
a. The Speer Ministry in June 1943 established a system of priority order numbers which governed the procurement of raw material by the various German factories. All orders for production were given order numbers, depending upon their importance, which placed them in one of five priority groups. Practically all orders for important army production, including trucks, received numbers with Group I, which was the top priority group.
b. A new system was decreed in July 1944 which differed from the old one chiefly in that new priority groups had been added at the top, Z and O. Such items as V-weapons, gasoline, jet planes, and development work fell in these three groups. Trucks continued to be in Priority Group I.
c. In January 1945, this system of priorities was completed discarded and a so-called "Critical Program" published. Under this program 13 types of armaments, mostly infantry weapons, were to have priority over all other production. Included in these items were trucks, half-tracks, and trailers, which were considered items of "infantry armament".
d. The emergency program of March 1945 finally cut off the supply of all raw materials for the motor vehicle industry, with the result that all production of trucks, half-tracks, tractors, etc. was scheduled to continued only as long as the raw material at a given plant could last. For most plants, production was scheduled to end in May 1945.
a. The following tables compare the 1944 labor force with the 1943 and 1940 labor forces:
Table 16
Composition of the Labor Force in the Motor Vehicle Industry
1943 and 1944
| Type | Number | Percent | ||
|---|---|---|---|---|
| 1943 | 1944 | 1943 | 1944 | |
| German men | 42,000 | 32,000 | 46 | 34 |
| German women | 11,000 | 17,000 | 12 | 18 |
| Foreigners | 39,000 | 46,000 | 42 | 48 |
| Total: | 92,000 | 95,000 | 100 | 100 |
Table 17
Composition of the Labor Force in the Motor Vehicle Industry
1940 and 1944
| Type | Number | Percent | |||
|---|---|---|---|---|---|
| 1940 | 1944 | 1940 | 1944 | ||
| Workmen | Skilled | 68,272 | 19,255 | 50.2 | 23.9 |
| Semi-skilled | 42,976 | 36,090 | 31.6 | 44.8 | |
| Unskilled | 24,752 | 25,215 | 18.2 | 31.3 | |
| Office | Technical | 10,005 | 9,357 | 34.5 | 64.8 |
| Statistical | 18,995 | 5,083 | 65.5 | 35.2 | |
b. It is difficult to determine whether there was even a labor shortage in the industry. The head of the Main Committee for Motor Vehicles does claim that a shortage existed from the last of 1943 until heavy loss of productive capacity due to bombing in the second half of 1944 left the industry with a surplus. The fact that the motor vehicle industry failed by such a large amount to reach maximum production in 1943 and 1944 before bombing shows that either supplies or labor was a limiting factor. The opinion of the plant survey team, based upon numerous plant interviews, was that this shortage was due to supplies and the labor force was sufficient to do the job of producing the number of vehicles possible with the components available.
c. After September or October 1944, the industry as a whole had a surplus of productive workmen. Many were used
for debris clearance and other similiar work, but were shown as productive labor on reports to the Labor Board so that they wouldn't be transferred.
a. Important savings in non-ferrous metals were effected by the virtual elimination of copper as a raw material for motor vehicle production. Steel wiring and tubing were substituted for the usual copper wiring and tubing, and chrome and tin alloys were to a large extent eliminated.
a. The fact that Germany in November 1943 planned 1944 truck production at a rate more than 50 percent greater than actual production in 1943 is a good indication of the importance the Germans themselves placed upon motor vehicle production at this time. The heavy loss of vehicles in North Africa, Italy and Russia was beginning to cripple the mechanized forces of the Army. Beginning in the fall of 1944, after the motor vehicle industry had been so heavily attacked that it could not replace the large losses in the battle of France, panzer divisions had to move partly by bicycle. Later on, they could only be moved by foot. This meant that panzer troops lost their primary characteristic, maneuverability, with the result that they were of little more value than infantry soldiers.
a. Six of the ten medium and heavy truck producing plants were subjected to 12 raids in which the plants were the aiming point for the attacks. During these raids 3,884 tons of HEs and 2,646 tons of IBs were dropped. On the other hand, only six of the remaining 26 plants of the motor vehicle industry were aiming points for precision attacks as truck targets. In 18 raids, 3,076 tons of HEs and 516 tons of IBs were dropped. In addition, 13 precision raids were aimed at motor vehicle plants primarily as producers of aircraft engines, ordnance products and V-1 components rather than as motor vehicle producers. During these latter raids were 3,246 tons of HEs and 1,266 tons of IBs were dropped. Many of these plants included in the above and most of the remaining plants were not selected as targets were damaged by attacks aimed at the cities in which the plants were damaged or by spillovers from attacks on nearby targets. In several cases (for example, Bussing in Brunswick)
the damage caused by area raids was much greater than that caused by precision raids on the plant.
a. Figures 5, 6, 7, and 8 compare damage by HEs and IBs at seven motor vehicle plants. With the exception of Daimler-Benz, Gaggenau, at which plant the IBs apparently missed the target to a large degree, IBs, compared ton for ton with HEs were very effective on motor vehicle plants. There were several cases in which HE bombing was immediately followed by incendiary bombing before the debris resulting from HE bombing had been cleared away. This resulted in damage in damage to machine tools and losses in production that exceeded the normal expectancy for the amount of building damage. These cases occurred in factory structures with wood roofs, wherein HE blast had caused the collapse of the combustible roof construction to the floor, thereby greatly increasing the vulnerability of machines, wiring, and materials to incendiary bombs. A high percentage of roofs in German plants were wood, even in the latest modern buildings, but particularly in the older types of structures. A negative example of this above principal is shown by the bombing of of the Auto-Union Siegmar Works. At this plant, a large one-story factory with a wood roof (280,000 sq ft) was completely destroyed by incendiary bombs and all of the 476 machine tools were damaged; but of this total only four percent was destroyed and the remainder were repaired and put back into use within 12 weeks. It is felt that if the wooden roof construction had first been collapsed by explosive bombs and then ignited by IBs, much larger destruction of machines would have resulted. Conversely, at the Heschel Tank and Truck Plant in Kassel, all combustible material not required in the manufacturing was removed from the plant and the dropping of incendiary bombs after the high explosive did little or no damage.
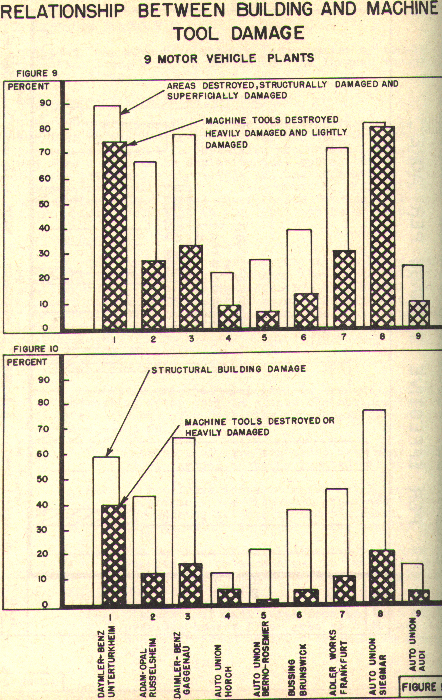
a. A survey of machine tool damage at nine motor vehicle plants gave no definite conclusions as to the most effective method either of knocking out machines or of determining damage from post-raid photo intelligence. Figures 9 and 10 show there is no fixed relationship between building damage and machine tool damage, outside of a general trend in the same direction.
b. At the Henschel Tank and Truck Plant in Kassel, it was the opinion of the managing director that out of 11 raids
on the plant, the attack in which a large number of 100-lb fragmentation bombs were dropped caused the largest amount of machine tool damage.
a. The disruption of transportation facilities from October 1944 to the end of the war was the indirect effect of bombing most successful in curtailing production. Plant officials were unanimous in declaring that operations at dispersed plants were practically impossible and that operations at main plants were greatly hindered by transportation difficulties during this period. This is the chief reason for the final decline in motor vehicle production in the first months of 1945.
a. The only method of recuperation from heavy plant raids used by the motor vehicle industry that was at all effective was dispersal. Even this was only effective only when a nucleus of dispersal plants had been set up before the raids so that the main plant could concentrate on repairing the vital departments which had not been dispersed, rather than repairing a completely integrated plant.
a. Adequate pre-raid dispersal is the only proved method of protecting motor vehicle plants against complete knockout by air attack. The following characteristics of dispersal are the basis for this theory:
(1) Machine tools are scattered over many small sites instead of being located all in one plant.
(2) It is almost impossible for intelligence to determine where dispersal sites are located or for bombing attacks to hit the small, scattered targets which dispersal plants usually present.
(3) The machines of vital departments can be located in two or more sites so that one bombing attack cannot knock a department completely out of production.
(4) Dispersal of facilities from the main plant provides excess floor area so that more damage can be absorbed before production is greatly reduced.
Exhibit A
Sales of Motor Vehicle Industry 1944, Plotted Graphically
in thousands of RM (corrected from millions of RM in the original)
This map is too big to be scanned and the data has been transmuted into the table below:
| Location | Company | Product | Sales |
|---|---|---|---|
| Hamburg | Vidal & Sohn | Trucks | 17,550 |
| Bremen | Borgward | Passenger Cars | 27,000 |
| Trucks | 51,810 | ||
| Total | 79,410 | ||
| Hannover | Hanomag | Passenger Cars | 36,100 |
| Tractors | 3,450 | ||
| Half-tracks | 18,350 | ||
| Total | 62,900 | ||
| Fallersleben | Volkswagenwerk | Passenger Cars | ? |
| Braunschweig | B�ssing-NAG | Trucks | 33,010 |
| Brandenburg | Opel | Trucks | 213,500 |
| Berlin | Daimler-Benz | Half-tracks | 5,740 |
| B�ssing-NAG | 2300 | ||
| Total | 8,040 | ||
| Stettin | Stoewer | Passenger Cars | 5,300 |
| Cottbus | MWC | Half-tracks | 16,100 |
| Breslau | FAMO | 3,440 | |
| Tractors | 4,760 | ||
| Total | 8,200 | ||
| Nesseldorf | Ringhoffer Tatra | Passenger Cars | ? |
| Zittau | Phanomen | Trucks | 14,850 |
| Brand-Erblsdorf | O.D. Werke | 7,400 | |
| Hainichen | Framo | 17,490 | |
| Chemnitz | Auto-Union | Motorcycles | 44,910 (Werke Zschapou) |
| Passenger Cars | 201,500 (Werke Zwickau) | ||
| 4,680 (Werke Siegmar) | |||
| Total | 293,210 | ||
| Plauen | Vomag | Trucks | 5,390 |
| Eisenach | BMW | Passenger Cars | 35,600 |
| Kassel | Henschel & Sohn | Trucks | 9,410 |
| Wetter | Demag | Half-tracks | 13,700 |
| Essen | Krupp | Trucks | 20,330 |
| K�ln | Ford | Passenger Cars | 83,000 |
| Trucks | 131,300 | ||
| Kl�ckner | Tractors | 10,684 | |
| Total | 224,984 | ||
| R�sselsheim | Opel | Passenger Cars | 391,000 |
| Frankfurt | Adler | 73,300 | |
| Mannheim | Daimler-Benz | Trucks | 18,800 |
| Lanz | Tractors | 32,000 | |
| Neckarsulm | NSU | Motorcycles | 29,900 |
| Gaggenau | Daimler-Benz | Trucks | 60,600 |
| Stuttgart | Daimler-Benz Zentrale | Passenger Cars | 99,700 |
| Kaelble | Tractors | 1,450 | |
| Standard | Motorcycles | 2,755 | |
| Trucks | 5,380 | ||
| Total | 109,285 | ||
| Ulm | Kl�ckner | Trucks | 31,010 |
| Friedrichshaven | Maybach | Trucks | 1,100 |
| M�nchen | BMW | Motorcycles | 9,510 |
| Krauss-Maffei | Tractors | 270 | |
| Half-tracks | 9,170 | ||
| Total | 18,950 | ||
| N�rnberg | MAN | Trucks | 10,700 |
| Faun | 4,050 | ||
| Tractors | 86 | ||
| Ardie | Motorcycles | 8,410 | |
| Hercules | 1,230 | ||
| Triumph | 9,510 | ||
| Victoria | 11,610 | ||
| Zundapp | 18,220 | ||
| Total | 63,816 | ||
| Steyr | Steyr-Daimler-Puch | Passenger Cars | 20,200 |
| Graz | Motorcycles | 4445 | |
| Wien | Fross-B�ssing | Trucks | ? |
| Grat & Stiff | |||
| O.A.F. | |||
| Osterr-Saurer | |||
Exhibit B
Map of Motor Vehicle Plants in Greater Germany, 1944
This is virtually illegible in my copy and has been omitted.
Exhibit C
Planned and Actual Production - Trucks
| 1944 | 1945 | ||||||||||||||||
|---|---|---|---|---|---|---|---|---|---|---|---|---|---|---|---|---|---|
| 1943 | 1944 | Jan | Feb | Mar | Apr | May | Jun | Jul | Aug | Sep | Oct | Nov | Dec | Jan | Feb | ||
| * 1-ton Trucks | Planned | 7518 | 6933 | 680 | 700 | 820 | 570 | 590 | 590 | 590 | 590 | 450 | 450 | 450 | 453 | 350 | 350 |
| Actual | 5955 | 5357 | 333 | 463 | 594 | 625 | 730 | 423 | 603 | 519 | 350 | 375 | 150 | 192 | 164 | 258 | |
| *1.5-ton Trucks | Planned | 17974 | 18955 | 1653 | 1315 | 1031 | 600 | 1025 | 1555 | 1735 | 1930 | 2030 | 2035 | 2035 | 2016 | 2010 | 2010 |
| Actual | 15711 | 17026 | 1645 | 1456 | 719 | 872 | 913 | 1425 | 1640 | 1849 | 1656 | 1517 | 1778 | 1556 | 1112 | 732 | |
| 3-ton Trucks (excl "Mules") | Planned | 70070 | 54683 | 3865 | 5275 | 5760 | 5246 | 6090 | 6510 | 5850 | 3817 | 2270 | 2700 | 3200 | 4100 | 2900 | 3650 |
| Actual | 48477 | 36728 | 3984 | 4653 | 4742 | 4043 | 4150 | 4867 | 4691 | 1782 | 1706 | 1040 | 760 | 310 | 800 | 540 | |
| 3-ton "Mules" | Planned | 12220 | 6200 | 1000 | 1000 | 1000 | 1000 | 700 | 500 | 500 | 500 | ||||||
| Actual | 12771 | 6224 | 903 | 1027 | 1018 | 878 | 749 | 436 | 497 | 520 | 166 | 30 | |||||
| Total 3-ton Trucks | Planned | 82290 | 60883 | 4865 | 6275 | 6760 | 6246 | 6790 | 7010 | 6350 | 4317 | 2270 | 2700 | 3200 | 4100 | 2900 | 3650 |
| Actual | 61248 | 42952 | 4887 | 5680 | 5760 | 4921 | 4899 | 5303 | 5188 | 2302 | 1872 | 1040 | 760 | 340 | 800 | 540 | |
| 4.5-ton Trucks | Planned | 13456 | 12130 | 1101 | 1100 | 1125 | 983 | 1110 | 1187 | 1316 | 1300 | 523 | 670 | 765 | 950 | 950 | 950 |
| Actual | 11455 | 9253 | 837 | 744 | 799 | 779 | 915 | 992 | 905 | 1131 | 678 | 482 | 501 | 490 | 505 | 322 | |
| 4.5-ton "Mules" | Planned | 700 | 886 | 206 | 200 | 200 | 115 | 115 | 50 | ||||||||
| Actual | 594 | 886 | 206 | 200 | 200 | 200 | 115 | 79 | 86 | ||||||||
| Total 4.5-ton Trucks | Planned | 14156 | 13016 | 1307 | 1300 | 1325 | 1098 | 1225 | 1237 | 1316 | 1300 | 523 | 670 | 765 | 950 | 950 | 950 |
| Actual | 12049 | 10139 | 1043 | 944 | 999 | 979 | 1030 | 1071 | 991 | 1131 | 678 | 482 | 501 | 490 | 505 | 322 | |
| *2.5-ton Trucks | Planned | 67 | 880 | 70 | 10 | 80 | 80 | 80 | 80 | 80 | 80 | 80 | 80 | 80 | 80 | 80 | |
| Actual | 112 | 572 | 39 | 24 | 17 | 85 | 65 | 10 | 30 | 108 | 46 | 10 | 87 | 51 | 40 | ||
| RS0 (Full Caterpillar 1.5-ton Truck) | Planned | 14566 | 13044 | 1054 | 1035 | 841 | 899 | 859 | 1156 | 1200 | 1200 | 1200 | 1200 | 1200 | 1200 | 1200 | 1200 |
| Actual | 14010 | 11942 | 1047 | 1080 | 1005 | 788 | 1027 | 1162 | 1206 | 1067 | 700 | 1206 | 1090 | 564 | 258 | 606 | |
| Grand Total | Planned | 136571 | 113711 | 9629 | 10635 | 10857 | 9493 | 10569 | 11628 | 11271 | 9417 | 6553 | 7135 | 7730 | 8799 | 7490 | 8160 |
| Actual | 109085 | 87988 | 8994 | 9647 | 9094 | 8270 | 8664 | 9394 | 9658 | 6976 | 5302 | 4630 | 4366 | 3193 | 2879 | 2458 | |
* Editor's Note: Figures indicated by asterisks were illegible in the original report and are therefore subject to correction.
Exhibit D
Planned and Actual Production - Half-tracks
| 1944 | 1945 | ||||||||||||||||
|---|---|---|---|---|---|---|---|---|---|---|---|---|---|---|---|---|---|
| 1943 | 1944 | Jan | Feb | Mar | Apr | May | Jun | Jul | Aug | Sep | Oct | Nov | Dec | Jan | Feb | ||
| * 1-ton Half-tracks | Planned | 5745 | 2630 | 210 | 210 | 215 | 215 | 220 | 225 | 225 | 225 | 225 | 220 | 220 | 220 | 220 | 220 |
| Actual | 5755 | 2527 | 210 | 195 | 225 | 215 | 212 | 218 | 212 | 211 | 220 | 243 | 253 | 113 | 50 | ||
| * 3-ton Half-tracks | Planned | 7604 | 10295 | 860 | 890 | 890 | 910 | 920 | 940 | 995 | 995 | 995 | 600 | 600 | 700 | 790 | 910 |
| Actual | 6731 | 9280 | 796 | 880 | 745 | 790 | 855 | 880 | 924 | 925 | 728 | 539 | 624 | 594 | 555 | ||
| * 5-ton Half-tracks | Planned | 558 | |||||||||||||||
| Actual | 564 | ||||||||||||||||
| Planned | 217 | 992 | 5 | 7 | 35 | 55 | 75 | 95 | 115 | 130 | 150 | 105 | 110 | 110 | 135 | 135 | |
| Actual | 5 | 746 | 17 | 10 | 27 | 49 | 46 | 84 | 95 | 87 | 90 | 112 | 92 | 37 | 23 | ||
| * 8-ton Half-tracks | Planned | 3800 | 4055 | 340 | 340 | 340 | 340 | 340 | 365 | 410 | 420 | 420 | 250 | 225 | 265 | 305 | 325 |
| Actual | 3320 | 3355 | 279 | 318 | 281 | 316 | 334 | 344 | 330 | 330 | 315 | 146 | 216 | 146 | 99 | ||
| * 12-ton Half-tracks | Planned | 890 | 890 | 70 | 70 | 75 | 85 | 85 | 95 | 125 | 125 | 135 | 25 | 40 | 80 | ||
| Actual | 401 | 600 | 48 | 60 | 92 | 58 | 1 | 109 | 111 | 60 | 40 | 21 | |||||
| * 18-ton Half-tracks | Planned | 632 | 1065 | 70 | 70 | 80 | 80 | 80 | 90 | 100 | 120 | 135 | 60 | 80 | 100 | 100 | 110 |
| Actual | 659 | 923 | 80 | 80 | 80 | 80 | 80 | 85 | 92 | 50 | 53 | 63 | 80 | 101 | 85 | ||
| Special Equipment | |||||||||||||||||
| Planned | 800 | 50 | 250 | 500 | 500 | 500 | |||||||||||
| Actual | 187 | 74 | 113 | 50 | |||||||||||||
| Steel Armored Vehicle cylinder Tatra | Planned | 150 | 50 | 50 | 50 | 60 | 60 | ||||||||||
| Actual | 118 | 35 | 47 | 36 | 44 | ||||||||||||
| Grand Total | Planned | 19446 | 19927 | 1555 | 1587 | 1635 | 1685 | 1720 | 1810 | 1970 | 2015 | 2060 | 1260 | 1235 | 1395 | 1590 | 1780 |
| Actual | 17435 | 17431 | 1430 | 1543 | 1450 | 1508 | 1528 | 1720 | 1764 | 1663 | 1446 | 1124 | 1265 | 991 | 812 | 0 | |
* Editor's Note: Half-track sizes were illegible in the original report and are therefore subject to correction.
Exhibit E
War Production - Occupied Countries
| Type | Plant | 1943 | 1944 | ||
|---|---|---|---|---|---|
| Planned | Actual | Planned | Actual | ||
| France | |||||
| 2-ton Trucks | Citroen | 70 | 73 | ||
| Renault | 1000 | 704 | |||
| Peugeot | 4200 | 2451 | |||
| Total 2-ton Trucks | 5270 | 3228 | |||
| 3.5-ton Trucks | Citroen | 5100 | 3027 | 5150 | 1536 |
| Renault | 7000 | 1730 | 9860 | 2138 | |
| Total 3.5-ton Trucks | 12,100 | 4757 | 15,010 | 3674 | |
| 4.5-ton Trucks | Berliot | 1180 | 862 | 1830 | 400 |
| Saurer | 590 | 512 | 1095 | 384 | |
| Total 4.5-ton Trucks | 1770 | 1374 | 2925 | 784 | |
| Total Trucks | 19,140 | 9359 | 17,935 | 4458 | |
| Italy | |||||
| 3-ton Trucks | Fiat | 3115 | 4251 | ||
| O.M. | 1420 | 2151 | |||
| 4.5-ton Trucks | Lancia | 810 | 646 | ||
| Total Trucks | 5345 | 6048 | |||
| Tractors | Vender | 145 | 95 | ||
| Savigliano | 52 | 77 | |||
| Total Tractors | 197 | 172 | |||
| Czechoslovakia Protectorate | |||||
| 3-ton Trucks | Asap | 1500 | 971 | 2200 | 1920 |
| Praga | 607 | 405 | |||
| Total Trucks | 2107 | 1376 | 2200 | 1920 | |
| Automobiles | Asap | 880 | 1019 | ||
| Aero | 480 | 242 | |||
| Total Automobiles | 1360 | 1261 | |||
| Tractors | Asap | 50 | |||
| Motorcycles | Bohemische Waffenfabrik | 400 | 60 | ||
| Jawa | 785 | 438 | |||
| Total Motorcycles | 1185 | 498 | |||
Exhibit F
Correlation of Actual Production July 1944 Through February 1945 with Pre-July Average to Determine Production Loss
a. Producers
| Vidal & Son | Hamburg |
| Borgward | Bremen |
| Phanomen | Zittau |
| Steyr | Steyr, Austria |
| Auto-Union | Zwickau |
b. Production Loss
| Month | Total Production | Loss or *Gain | Remarks |
|---|---|---|---|
| ** Pre-July Monthly Average | 2,210 | ||
| July 1944 | 2,243 | *33 | |
| August | 2,368 | *158 | |
| September | 2,006 | 204 | Bombing of Borgward 30/8 & 26/9/44 ending all production |
| October | 1,892 | 318 | Bombing of Steyr 16/10/44 stopped production for 2 mos. Light bombing of Auto-Union 7/10/44 |
| November | 1,928 | 282 | |
| December | 1,748 | 462 | General deterioration in addition to the effects of plant raids |
| January 1945 | 1,276 | 934 | |
| February | 990 | 1,220 | |
| Total | 14,451 | 3,611 | |
** This includes an allowance of 3,000 trucks for the 6 months period January-June 1944 to compensate for the loss due to bombing the Steyr Plant in February and March 1944.
a. Producers
| Adam Opel | Brandenburg |
| Ford | Cologne and other assembly plants |
| Daimler-Benz | Mannheim |
| Borgward | Bremen |
b. Production Loss
| Month | Total Production | Loss or *Gain | Remarks |
|---|---|---|---|
| ** Pre-July Monthly Average | 5,240 | ||
| July 1944 | 5,188 | 52 | |
| August | 2,302 | 2,938 | Destruction of Opel 6/8/44. End of French Ford production |
| September | 1,872 | 3,368 | Raids on Borgward 30/8 & 26/9/44 |
| October | 1,040 | 4,200 | |
| November | 760 | 4,480 | Virtual end of Ford production as a result of heavy area destruction to Cologne |
| December | 340 | 4,900 | |
| January 1945 | 800 | 4,400 | |
| February | 540 | 4,700 | |
| Total | 12,842 | 29,078 | |
a. Producers
| Bussing-NAG | Brunswick |
| Daimler-Benz | Gaggenau |
| Saurer | Vienna, Austria |
| 4 small producers |
b. Production Loss
| Month | Total Production | Loss or *Gain | Remarks |
|---|---|---|---|
| ** Pre-July Monthly Average | 1,030 | ||
| July 1944 | 935 | 95 | |
| August | 1,239 | *209 | Bombing of Bussing NAG 5/8/44 |
| September | 724 | 306 | Almost complete destruction of Gaggenau 10/9 & 3/10/44 |
| October | 492 | 538 | Bombing of Bussing NAH 22/10/44. Raids on two small producers |
| November | 588 | 442 | |
| December | 541 | 489 | |
| January 1945 | 545 | 485 | |
| February | 322 | 708 | |
| Total | 5,386 | 3,272 | |
a. Producers
| Klockner-Humboldt-Deutz | Ulm |
| Graf & Stift | Vienna, Austria |
b. Production Loss
| Month | Total Production | Loss or *Gain | Remarks |
|---|---|---|---|
| ** Pre-July Monthly Average | 1,020 | ||
| July 1944 | 1,206 | *186 | |
| August | 1,067 | *47 | |
| September | 700 | 320 | Light attack on Klockner 12/9/44 |
| October | 1,206 | *186 | |
| November | 1,090 | *70 | |
| December | 564 | 456 | Heavy area raid on Ulm 17-18/12/44, disrupting the city and damaging Klockner |
| January 1945 | 258 | 762 | |
| February | 606 | 414 | |
| Total | 6,967 | 2,441 | |
Exhibit G-1
Distribution of Motor Vehicles in Graphic Format

Exhibit G-2
Distribution of Motor Vehicles
| Year | Type | Percent to Army | Percent to Economy | Percent to Export |
|---|---|---|---|---|
| 1934 | Motorcycles | 4.0 | 93.2 | 2.8 |
| Passenger Cars | 2.7 | 89.6 | 7.7 | |
| Trucks | 6.2 | 85.9 | 7.9 | |
| 1935 | Motorcycles | 5.3 | 90.0 | 4.7 |
| Passenger Cars | 4.5 | 85.7 | 9.8 | |
| Trucks | 15.6 | 75.3 | 9.1 | |
| 1936 | Motorcycles | 5.1 | 86.7 | 8.2 |
| Passenger Cars | 3.9 | 83.7 | 12.4 | |
| Trucks | 10.4 | 80.1 | 9.5 | |
| 1937 | Motorcycles | 5.5 | 86.7 | 8.2 |
| Passenger Cars | 2.1 | 76.3 | 21.6 | |
| Trucks | 16.1 | 66.1 | 17.8 | |
| 1938 | Motorcycles | 7.2 | 75.6 | 17.2 |
| Passenger Cars | 4.7 | 73.1 | 22.2 | |
| Trucks | 26.0 | 58.3 | 15.7 | |
| 1939 | Motorcycles | 14.8 | 69.5 | 16.5 |
| Passenger Cars | 8.0 | 66.7 | 25.3 | |
| Trucks | 32.0 | 52.0 | 16.0 | |
| 1940 | Motorcycles | 46.9 | 41.5 | 11.6 |
| Passenger Cars | 42.2 | 38.5 | 19.3 | |
| Trucks | 60.7 | 24.6 | 14.7 | |
| 1941 | Motorcycles | 56.6 | 31.8 | 11.6 |
| Passenger Cars | 77.0 | 9.1 | 13.9 | |
| Trucks | 59.3 | 25.2 | 15.5 | |
| 1942 | Motorcycles | 62.7 | 18.5 | 18.8 |
| Passenger Cars | 87.3 | 4.6 | 8.1 | |
| Trucks | 72.1 | 21.2 | 6.7 | |
| 1943 | Motorcycles | 82.5 | 11.5 | 6.0 |
| Passenger Cars | 94.9 | 2.9 | 2.2 | |
| Trucks | 79.8 | 15.9 | 4.3 | |
| 1944 | Motorcycles | 72.3 | 5.7 | 22.0 |
| Passenger Cars | 97.1 | 2.5 | 0.4 | |
| Trucks | 87.3 | 9.8 | 2.9 |
Return to the Table of Contents of the United States Strategic Bombing Survey.
Return to The Sinews of War.
