
|
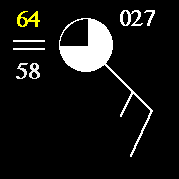
Temperature:
The value highlighted in yellow located in the upper left corner is the temperature in degrees Fahrenheit. In this example, the reported temperature is 64 degrees. Temperature:
|
 |
Weather
Symbol:
The weather symbol highlighted in yellow indicates the type of weather occurring at the time the observation is taken. In this case, fog was reported. If there were thunderstorms occurring when the observation was taken, then the symbol for thunderstorms would have appeared instead. (Click to see the other weather symbols that are used.) |
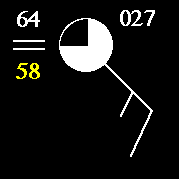 |
Dew
Point Temperature:
The value highlighted in yellow located in the lower left corner is the dew point temperature in degrees Fahrenheit. In this example, the reported dew point temperature is 58 degrees. |
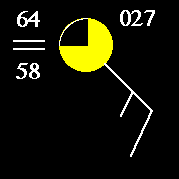 |
Cloud Cover: The symbol highlighted in yellow indicates the amount of cloud cover observed at the time the observation is taken. In this case, broken clouds were reported. |
 |
Sea Level Pressure: The value highlighted in yellow located in the upper right corner represents the last three digits of the sea level pressure reading in millibars (mb). If reported value greater than 500: Initial 9 is missing. Place
it on left, then divide by 10.
If reported value less than 500: Initial 10 is missing. Place
it on left, then divide by 10.
|
 |
Wind Barb: The symbol highlighted in yellow is known as a wind barb. The wind barb indicates wind direction and wind speed. Wind barbs point in the direction "from" which the wind is blowing. In the case of the diagram below, the orientation of the wind barb indicates winds from the Northeast. Each short barb represents 5 knots, each long barb 10 knots. A long
barb and a short barb is 15 knots, simply by adding the value of each barb
together (10 knots + 5 knots = 15 knots). If only a station circle is plotted,
the winds are calm. Pennants are 50 knots.
|
