
 |
Graphs for the Global Sun Temperature Project |
1. What was our problem?
2. What was our hypothesis?
3. What do you expect to see on
the graphs we would make from the data?
 |
 |
4. Look for patterns. What
patterns do you see in each graph?
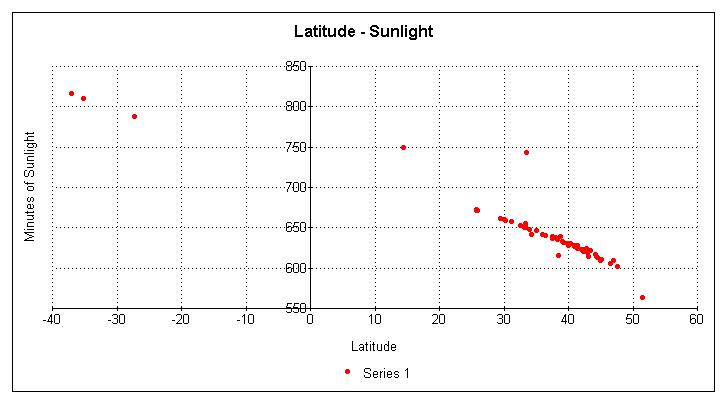
Sunlight graph
?
Temperature graph
?
5. Pick a location.
Do you think
the temperature would be higher or lower than it is at our school? Why?
6. Why do you think temperatures
vary at different latitudes? (Your answer will be a
hypothesis.)
7. At which latitudes are number
of sunlight hours greatest? Why?
8. At which latitudes are number
of sunlight hours least? Why?
9. Is there a relationship between
the number of sunlight hours and latitude?
10. How important was accuracy of measurement
in this experiment?
11. Would you change anything if you could repeat
this experiment?
12. Write a conclusion. (What did we learn?
How did we interpret the results? What would we do differently next time?)
