
Bar graphs have bars. The bars help you compare
measurements,
amounts, and changes.
What do you think is the typical amount of letters in
the last names of
people in a class?
First gather data about the number of letters of students
in class.
Data Table:
| Letters
1 2 3 4 5 6 7 8 9 10 11 12 13 14 15 |
Students
2
1
|
If you organize the data into a graph you can determine
the typical
name length.
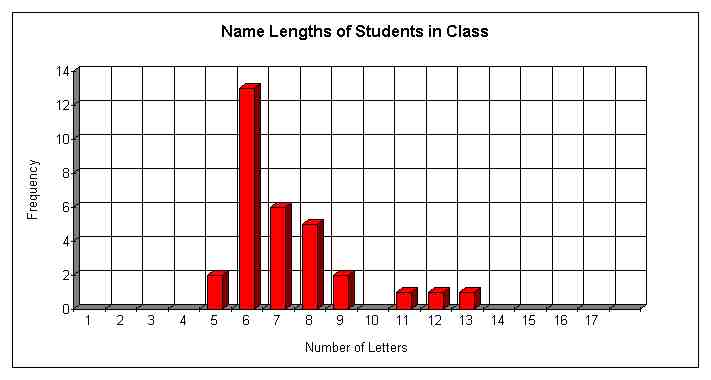
1. Write a statement about the name lengths for students in this class.
2. Describe any patterns you see.
3. If a new student joined the class, what would you predict
about the
length of that students name?
4. Suppose a new student named Jane Smith entered the
class. How
would you change the graph to include the data for Jane?
(last name)
Go to: bar
graphs
circle
graphs
line
graphs
