|
|
Acceleration and Constant Velocity Safety: Wear goggles in the lab area. You may remove the goggles when working at the computers.
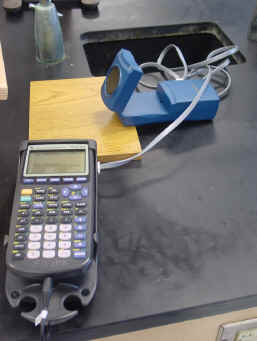
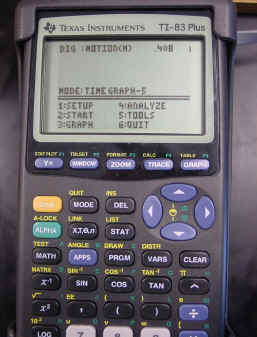
Procedure: Press the "APPS" key on the calculator and select "Datamate". Set up Motion Detector on CBL in DIG-Motion Channel. Collect Data as a Time Graph with 0.02 second intervals for 100 points. (The CBL may be setup for you.)
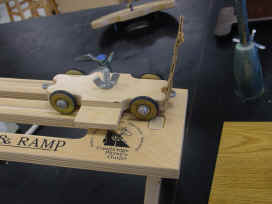
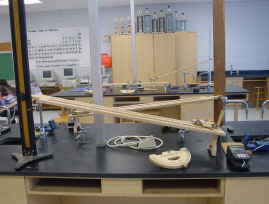
Tape or glue a piece of cardboard to the front of the cart. Level the ramp with a level. Place the detector slightly above and aligned with the top of the ramp. You may want to rest the detector on a stack of books. The detector should be about one foot from the end of the ramp. You should get a reading of over 1 at the greatest distance and approximately 0.4 at the closest distance. When ready press "2" to start (Read the Menu). When the detector starts clicking, give the car a gentle push. It will stop sampling on its own. After sampling go to the main screen (Read the Menu). Quit the program (Read the Menu). Time is in L1, distance is in L6, velocity is in L7, and acceleration is in L8. Disconnect the cable from the calculator and remove the calculator from the cradle. Take the calculator to a computer with a cord that connects to the calculator. Double click on the Graphical Analysis icon on the computer screen. After the program starts, click on the "OK" button. In the upper left corner is the File button. Select "Import From". Select "TI Device". Follow directions on the screen. Select L1, L6, L7, and L8. Save the data to the hard drive. Use the first 6 letters of your last name with a number representing which set of data you are saving. Save all your data to the same computer and remember which computer you have used. You can transfer your data to a floppy at a later time and work on your calculations at home. You can also come in and work on Graphical Analysis at school. Repeat after reconnecting calculator with a different push using the level ramp. Use the above procedure with the ramp at an angle between 5o and 10o. Repeat with an angle between 10o and 15o. Repeat with an angle between 15o and 20o. Calculations: It will be necessary to delete inappropriate data from each trial. The deleted data will include the data with the level ramp before the car at stopped accelerating and after it had stopped. The deleted data for ramps at an angle will include data before you released the car and after the car at stopped. Constant velocity data, graph position vs time. The slope is the velocity. Constant acceleration data, graph position vs time. This will give you a
curved line. The slope at any point will be the velocity at that point.
Graph velocity vs time. The slope will be the acceleration. |