|
|
Acceleration of Gravity
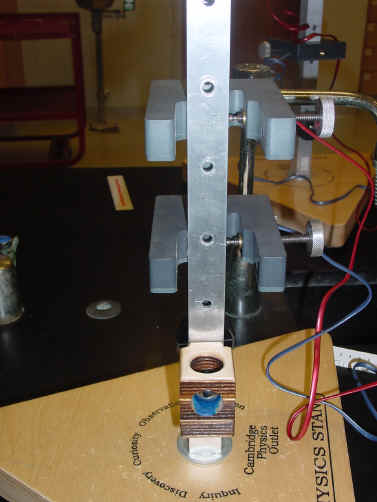
Procedure Part A:
Setup gravity drop apparatus with photogates approximately 5 cm apart measured to the nearest 0.1 cm. Measure this distance from the middle of one eye to the middle of the other eye. Also measure distance from bottom of ball to the middle of the top photogate eye. Set timer on interval. Release ball and record the time. Repeat at the same settings. Move the release mechanism further down the stand making the same measurements. Continue until you have the time interval at 6 different distances. Repeat using the other type of marble. Calculations: Use the average time interval for each displacement. Calculate the average velocity at each displacement. The displacement used to calculate the average velocity is the distance between the photogates. The displacement used to calculate the acceleration is the distance from the bottom of ball at rest to the mid point between the photo gates. The initial velocity and initial displacement are 0.
v2 - vo2 solve for acceleration at each placement. xo and vo are both 0. Calculate average acceleration, standard deviation, and percent standard deviation. Calculate the Percent Error in the average acceleration. The theoretical value is 9.80 m s -2.
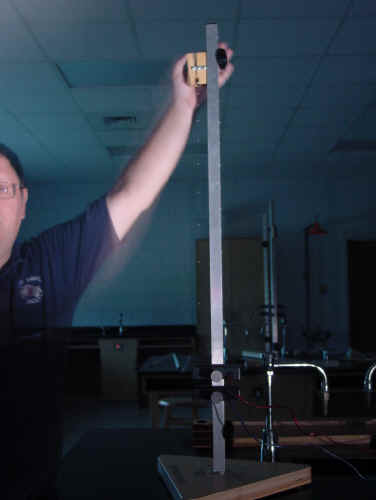
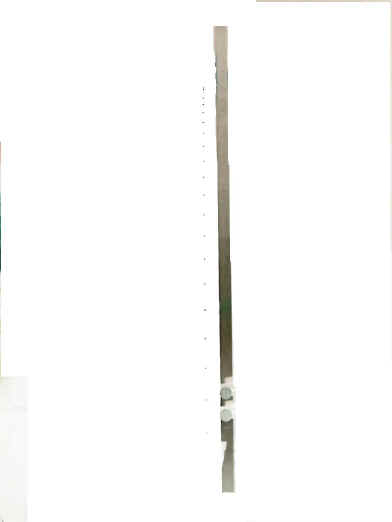
Procedure Part B:
Write equality measured length stand cm = 1.01 meters Measure the distance between consecutive dots. Ignore dots that are too close together to properly measure. Use the above equality to convert to the actual distance between the dots. Average velocity between consecutive dots = distance / 0.020 seconds Graph average velocity vs total time. Slope of the line is the experimental acceleration of gravity. Calculate the percent error in the acceleration of gravity. The theoretical value is 9.80 m s -2. |