


Globally, aquaculture is playing an increasingly larger role in food security, accounting for over half the world’s seafood consumption. This U.S. industry has been growing rapidly over the past several decades, yet almost two-thirds of U.S. seafood consumption is still imported. By providing easy-to-use tools displaying detailed consumer preference data by locality and region directly to aquaculture operators and other industry stakeholders, informed decisions can be made about their business that will help ensure the profitability of their operations. Our findings aim to foster the expansion of the domestic aquaculture industry, potentially reducing the trade deficit, while enhancing the opportunity to provide locally produced seafood products to U.S. customers. Intensive business and economic research resulted in three accomplished objectives:
Atlantic, in collaboration with Dynata, a first-party data company, collected a random and census-representative sample of at least 400 responses from each of the 50 U.S. states, resulting in 20,029 respondents. This sample size adequately represents consumers across the U.S. and their attitudes and preferences toward 13 species of finfish and shellfish. It was hosted and administered from June to August 2022. Resulting data were reviewed, analyzed, and summarized by an independent consultant, Dr. Qiujie Zheng, from the University of Maine, Maine Business School.
National Level:
State Level:
Nine U.S. Census Regions:
Finfish
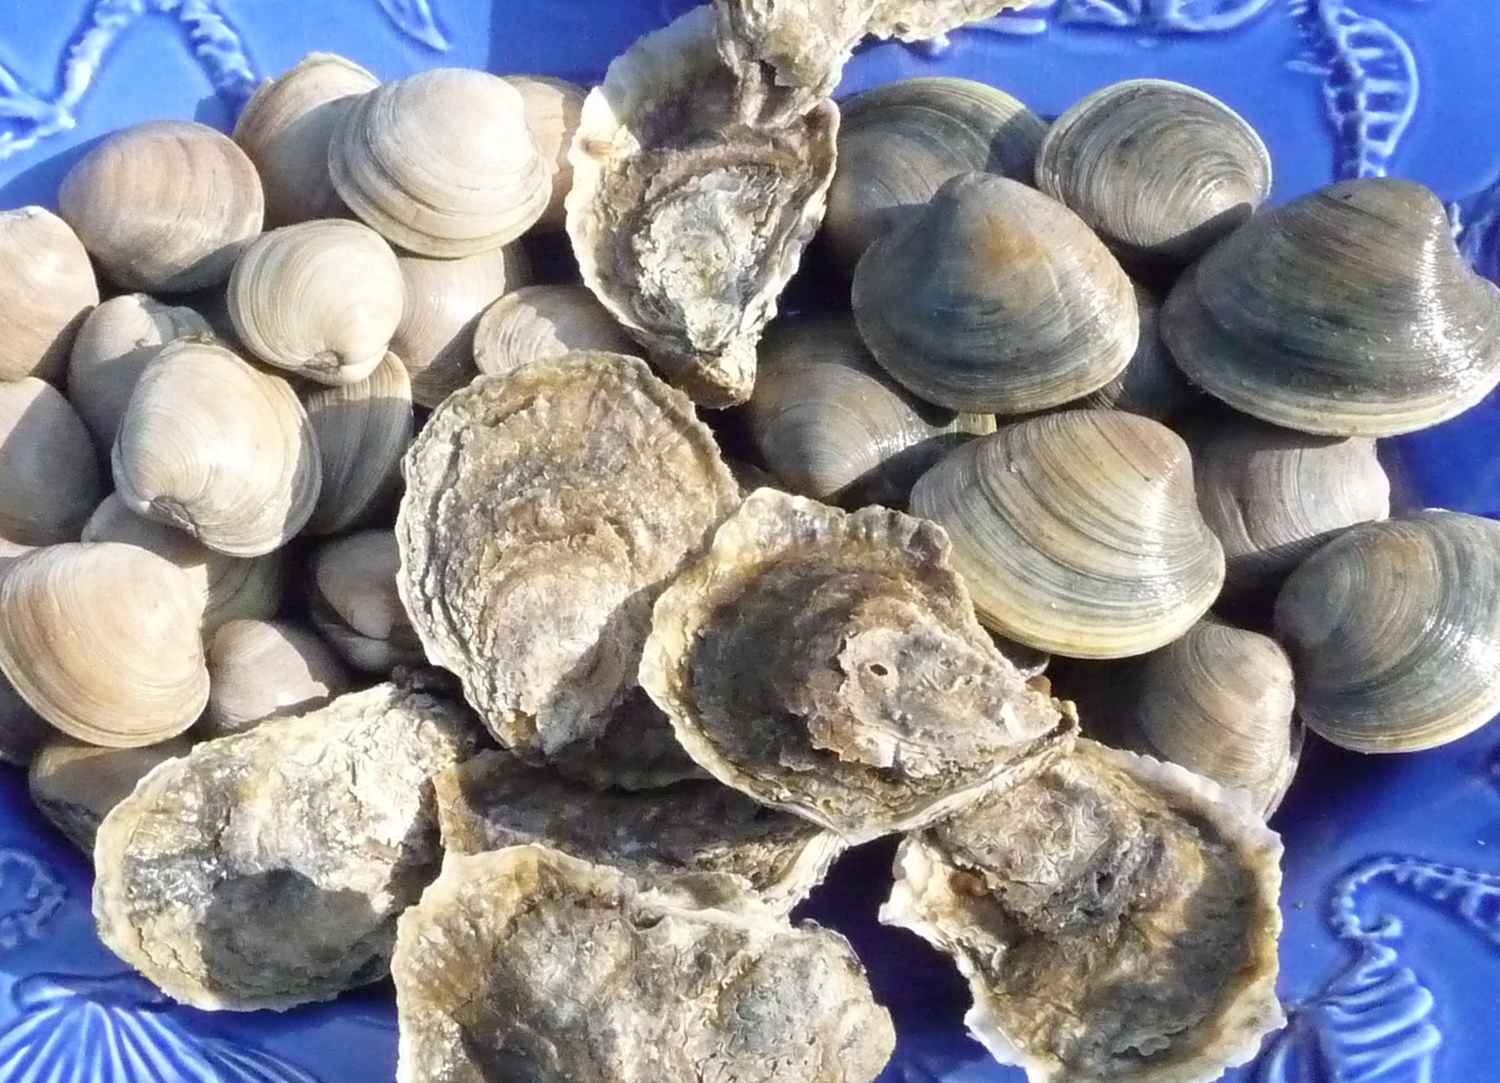
Shellfish
Affiliations:
This tool was prepared by Atlantic Corporation and is funded as part of a grant from the United States Department of Agriculture, National Institute of Food and Agriculture, Agriculture and Food Research Initiative under award number 2022-67023-36379. The statements, findings, conclusions, and recommendations are those of the author(s) and do not necessarily reflect the views of the United States Department of Agriculture, National Institute of Food and Agriculture, or the Agriculture and Food Research Initiative.
Atlantic Corporation is a leading agricultural business and economic research and development firm, conducting increasingly important market research for local food, agriculture, and aquaculture development, often spearheading large-scale public-private research collaborations and projects. We have completed major market assessment projects for the USDA through their SBIR, AFRI, and LFPP grant programs; NOAA; and many state governments, non-profits, and commercial enterprises. Our work has been widely published in white papers, reports, agricultural economic journals, and presented at regional and national conferences.
For data requests and questions related to this survey, please contact Atlantic Corporation.

This app is best viewed in a modern browser (such as Chrome, Safari, or Firefox) on desktop mode. If you have trouble viewing, try updating your browser and clearing your browser cache.
SeafoodMAPS has two main results that can be found in the tabs along the top of the page: General Findings and Insights.
General Findings contain survey results on consumer spending and preferences for each of the seafood products included: striped bass-hybrid, California yellowtail, cobia, drum (red or black), halibut, salmon, sturgeon, shrimp, abalone, clams, mussels, oysters, and scallops .
Insights presents results that relate to unmet market demand, premium pricing, consumer knowledge of their available seafood, and consumer concern about industry impacts.
Below is a guide to using SeafoodMAPS.
Along the left side of SeafoodMAPS is a toggle display for you to select a variable to be displayed on the map. You can click on the category name to expand or minimize a section.
Next you can select a variable which will be displayed on the map to the right.

Now that we’ve selected a variable to view, we see different shades of blue over each state. The darker, more saturated blues indicate higher values while lighter shades of blue indicate lower values. The color palette is standardized for related variables (example: Premium Pricing of $10 per month is the same color for shrimp or salmon). The legend is located in the bottom right corner of the map and includes the units of measure.

You can hover the cursor over a state to learn about the survey responses in that area. This information appears in the top right section of the browser.
The General Findings map displays additional information about the consumer ratings of product qualities, while the Insights map displays additional concerns and willingness to pay of consumers.

In the top left corner of the map are zoom options if you would like to view the United States larger or smaller. You can click and drag the map with your mouse to pan around and see more of the map.

If you would like to see the values averaged over a region, pan over this symbol on the upper left corner of the map, below the zoom buttons, to open up the "Level of Detail" map layers panel. Here you can select the level of detail to view averages based on state, region, or the entire United States.

Hover over the [?] on the left side of the variable name to see the full text of the survey question pertaining to that variable.
Alaska
Hawaii