Choose how many rows and columns you
want, and how thick of a border you want, and
then click OK. When the table has been placed, you can change the
size of it by the 8 white
boxes on the corners, and in the middle of each side. You can
also move it left or right with
the left and right indents.
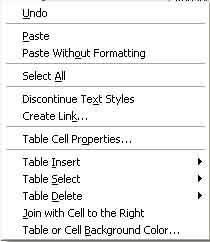
You can change the color of each individual cell on your table by right
clicking in the cell, then
clicking Table or Cell Background Color, shown in the image
below. You can also join cells
by highlighting 2 or more next to each other, right clicking, and then
selecting Join with Cell,
which is also shown in the figure below.
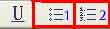
Charts:
To create a chart, you must select one of two kinds, bulleted, or
numbered, both located to the
right of the underline text button. When you click the button of
which chart you want, the chart
will start where you were last typing. Fill in all the
information that you want, and then to finish
the chart, just hit enter a few times after your last entry, and it
will end the chart, and let you
continue typing normally.