|
We
see from (17) and (18) that both parameters K and  input have the
amplitude input have the
amplitude  K
, input and
phase K
, input and
phase  K
, input
parts, and for different bands of K
, input
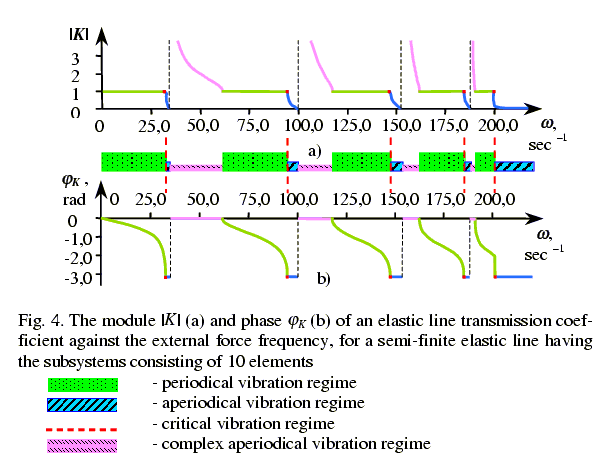
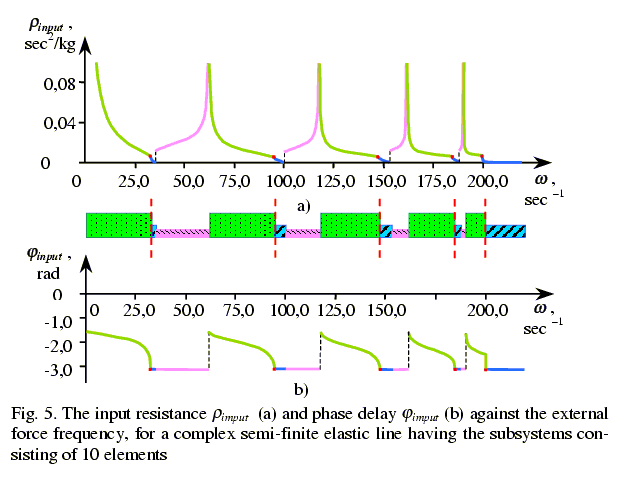
parts, and for different bands of  g variation they differ. In Figures 4 and
5 the typical form of these parameters is shown for the case when the
resonance subsystems contained 10 elastically connected bodies each. To
visualise, under each plot we give the scale of regimes corresponding to the
conditions (17) and (18). It is seen clearly that all these regularities
consist of sequentially alternating regions of the above regimes. All the
resonance peaks locate at frequencies higher than critical for an elastic
system as a whole, i.e. higher than the frequency before which we can
consider the system, disregarding the substructure of its elements. With
variation g variation they differ. In Figures 4 and
5 the typical form of these parameters is shown for the case when the
resonance subsystems contained 10 elastically connected bodies each. To
visualise, under each plot we give the scale of regimes corresponding to the
conditions (17) and (18). It is seen clearly that all these regularities
consist of sequentially alternating regions of the above regimes. All the
resonance peaks locate at frequencies higher than critical for an elastic
system as a whole, i.e. higher than the frequency before which we can
consider the system, disregarding the substructure of its elements. With
variation  from zero
to the first maximum, the input resistance falls from F0/2s
g to zero. But practically, at this entire band the transfer
function modulus is equal to unity. At frequencies exceeding the boundary
frequency for the system as a whole, in simple models the aperiodical regime
of antiphase damping vibrations is usually expected, but when taking the
substructure into account, we see a resonance peaks succession. Each peak for
the parameter K is formed at the joints of aperiodical and complex
aperiodical vibration regimes, and for input – at the joints of
complex aperiodical and periodical vibration regimes. The number of these
peaks depends on the subsystem size and is equal to the integer part of the
value [(n – 1)/2]. This last is determined by the denominator of the
first expression of (7). from zero
to the first maximum, the input resistance falls from F0/2s
g to zero. But practically, at this entire band the transfer
function modulus is equal to unity. At frequencies exceeding the boundary
frequency for the system as a whole, in simple models the aperiodical regime
of antiphase damping vibrations is usually expected, but when taking the
substructure into account, we see a resonance peaks succession. Each peak for
the parameter K is formed at the joints of aperiodical and complex
aperiodical vibration regimes, and for input – at the joints of
complex aperiodical and periodical vibration regimes. The number of these
peaks depends on the subsystem size and is equal to the integer part of the
value [(n – 1)/2]. This last is determined by the denominator of the
first expression of (7).
|