
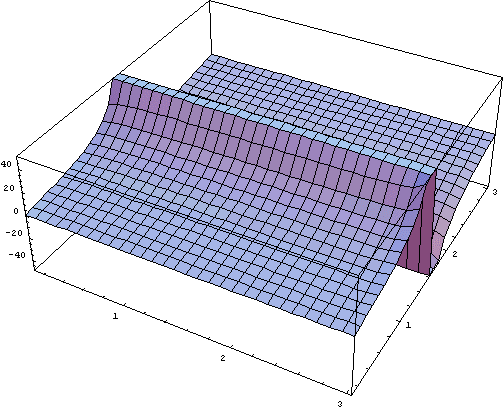
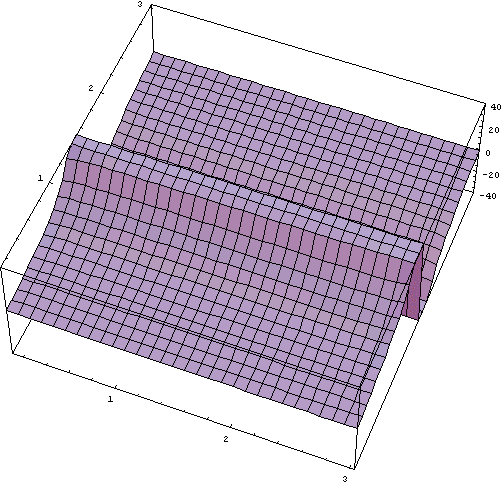
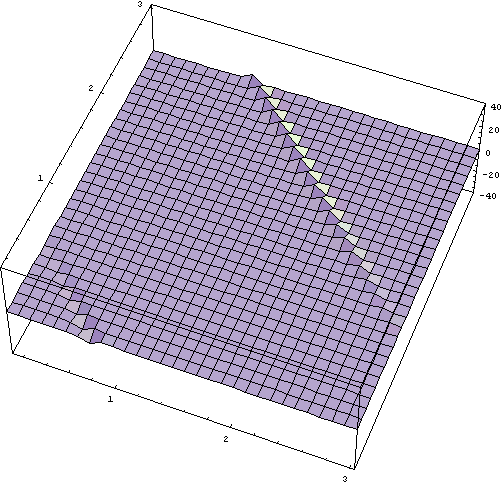
Solving problems can be fun, but sometimes it is enjoyable to just let the computer churn out interesting graphs. Some of these graphs represent important mathematical functions, while others represent neat pictures. Enjoy. For anyone loading this page over a 56 K modem or less, these pages have many graphics, but if it makes you feel any better, I feel your pain; I uploaded them on a 56 K.

This is essentially a strip of paper that has been twisted once and taped back together so that if you run your finger along it you will cover both the inside and the outside. Actually, because of that, there is no real inside or outside of a mobius strip. The interesting concept behind these is that they are the result of taking a two dimensional structure (the paper), and twisting it into three dimensions in one place. Now, what would happen if you were to do that with a three dimensional object? Enter the Klein bottle.
This first Klein bottle is essentially a Mobius strip that has been twisted into four dimensions. The code for this bottle came with Mathematica (I modified it slightly for higher resolution). To give an idea of its complexity, it requires my 900-megahertz laptop a couple of minutes to graph this figure.
This is the traditional Klein bottle. The big opening leads into the little tube which wraps back around to the large portion. Actually, if it were actually in four dimensions it would work a little differently, but we cannot visualize four dimensions well.

Since these are only three-dimensional representations of four-dimensional figures, they are lacking in some areas, but they are the best we have. If nothing else, they look interesting.
These are large files, so I have attached them as links. For some I also have a smaller version of the animation that I generated at a lower resolution with fewer computations.
Four-Dimensional Altitude: This is the animation of the tangent theorem for altitude. This is one of my favorite graphs, one that I can just sit and watch.
Normal Resolution Higher Resolution
Four Dimensional Altitude with Law of Sines: This is a graph of the law of sines theorem for altitude. I find it slightly less scenic but still very interesting.
Standard View (theta rotates from 0 to Pi)
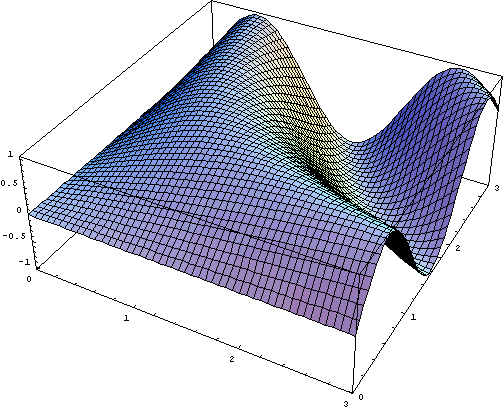
Flowing Sine Curve: This is the flowing of a sine curve in three dimensions (the sin of x and y). It moves remarkably like a wave. The file is large, but worth it. Both the x and y variables rotate from 0 to Pi in this graph
Flowing Sine Curve
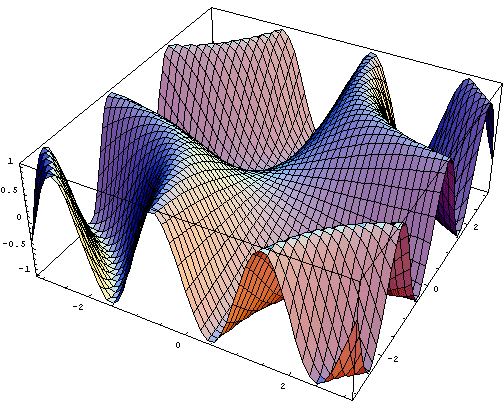
Sine Curve with a larger area of view: This is a larger view of the above curve that shows the other waves around it (x and y range from -Pi to Pi). It is a remarkably different picture.
Full Sine Curve
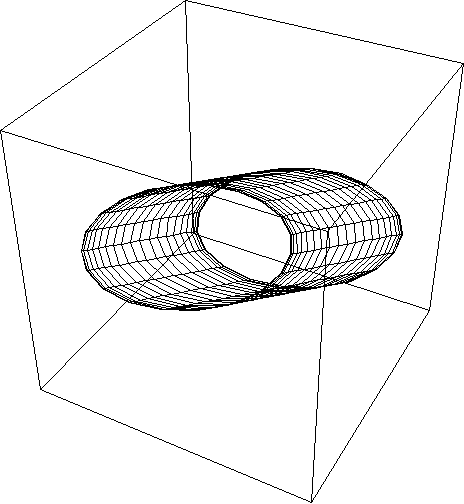
Spinning Torus: Just a neat animation of a rotating torus.
Rotating Torus
Have you ever wanted to know the factorial of 1,000,000? That is, 1,000,000 * 999,999 * 999,998 * 999,997…* 2 *1. As you can see, this is a relatively large number. Well, one day I decided to see just how many digits my computer could handle, so I asked for one million factorial. Here it is, just in case you ever need it. It took my computer about five minutes to solve for it. I will upload it as soon as I find a way to do so without taking up too much space...right now it is about five megabytes as a text file.
