This is just a temporary location that I've sent
everyone to while I'm revising the site. The links at the top of the page
are not active at the moment so clicking on them will result in an error.
Everything will be back to normal once I complete the revisions.
|
S&P500: Review of the Commitments of Traders Report
Updated Friday July 18, 2003 for the week ending July 15

Note (this note is identical to last week's note): As all of you already know, I consider the activity of the commercial traders to be by far the most interesting, informative & influential of the 3 groups (commercial, non-commercial & nonreportable) included in the Committments of Traders Report, so I mainly discuss that group...Also, my calculations combine the standard S&P500 contract with the mini contract. I adjust the mini by using the 5:1 fungibility ratio.
|
Click on Chart for Larger View...If You Do That, Click on Your Browswer's "Back" Button to Return Here

After a tiny increase of just 320 contracts last week the net position of the commercial traders this week increased by 5018 contracts. This total was reach as the large contract dropped by 346 while the mini contract jumped by 5,364 (the mini is now near the break-even level). The net postion now stands at -39,911 which is its best level in 6 weeks. Even so, it is still range bound.
Click on Chart for Larger View...If You Do That, Click on Your Browswer's "Back" Button to Return Here

This week's increase of 5,018 means that the net position has managed to move above the -45k support level. This -45k level has repeatedly acted as a test level over the past couple years. That's about as interesting as it gets this week though. At the current -39,911 level, the commercial traders are still in a holding pattern as their net position has held in the tight range of -35k to -53k for over 3 months now. If the net position can break this 3+ month range, the next interesting levels to keep in mind are -64k (support) and -11k (resistance)...The S&P500 cash index was little changed this week as it inched down by 0.7% to leave it near it's swing high level hit in mid-June.
Click on Chart for Larger View...If You Do That, Click on Your Browswer's "Back" Button to Return Here
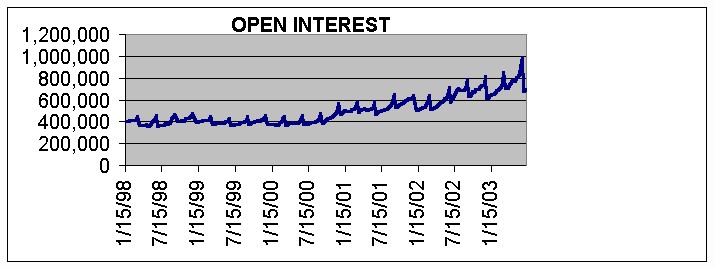
Open interest interest this week fell by 1.1% following 2 weekly gains of about 1% each. Open interest these 3 weeks have been extremely calm after some wild swings in the 4 weeks before that. Right now open interest is a little over 30% lower than the peak reached in mid-June.
My general impression of this latest report is that the commercial traders are still in a holding pattern. The last few weeks I've stated that the commercial traders don't look like they are making any new statements in either direction & that is still basically true this week. About the most I can say of interest about this report is that it looks like there is a very minor hint that the commercial traders may be ready to make some noise to the upside. While that is very speculative at this point I think it's at least worth keeping in mind...That's about all I have to say but Heidi has something to show you.

|
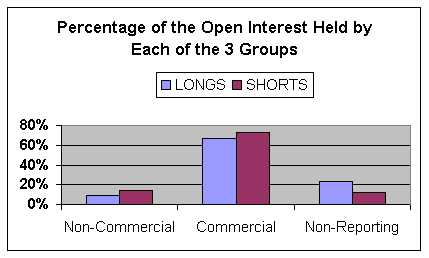
Yikes!...She tried to take that bikini off once again but I was able to again stop her just in time. For those of you interested in scantily clad women and/or power tools, check out the ad at this link. Caution: You probably should not do this at work but if you do turn the sound down first...For those still here, below is a chart that details how much of the total $172 trillion in current open interest is held by each of the 3 groups included in the Commitments of Traders Report.
|
|

To see the data for large commercial traders (& large non-commercial traders) click on the friendly woman to the left.