Abstract: Blue bar in C. livia has been defined as part of the wild type complex of genes. Much has been written about the pigment in this phenotype. However, there seems to be no ready source of microscopic pictures available to actually show what the pigment distribution looks like to the eye. Numerous surprises were observed during collection of such images. This paper will present results and photographic images taken through an optical microscope of both the blue areas and wing bar on secondary flights, the tail bar, the end portion of primary flights and chest feathers at magnifications ranging from 100X to 970X. Both pigment concentration differences and pigment granule size differences were observed.
Introduction: Hollander has been widely cited as saying that the pigment granules in blue bar pigeons differ from area to area in dispersion. Therefore, it is probably good to review the latest citation he wrote on the subject. Hollander1 wrote, “…its wing bar is a row of black spots with a rather rough looking outer edge, so we have named it ‘coarse-spread’ area. By contrast, look at the tail band: here the black area intergrades almost imperceptibly with the adjacent blue, so we have named it ‘smooth-spread’. The ends of the flights also appear smooth-spread.” Levi2 is even less definitive in his discussion on the smooth spread, coarse spread issue saying, “Under the microscope, the pigment granules are black and densely aggregated, not clumped. No visible difference is found under the microscope between black in different regions, but some sort of distinction does exist.”
It seems time to put pictures in a public forum where everyone can judge for themselves what the pigment patterns are like in various areas of the blue bar pigeon.
Conclusions: The amount of total pigment deposited occurs in the following order: blue areas < the bar on secondary flights < the tips of the primary flights < tail bar. In blue and in the bars on secondary flights, pigment granules are round balls easily resolvable at 970X magnification. The granules seen in blue areas are quite uniform in diameter at about 1 micron while those in the bars on secondary flights are somewhat smaller and not so uniform in size. In blue areas almost all the pigment is in the barbs. The barbules have isolated areas with groups of pigment granules. This pigment does show as aggregates. I do not interpret this as clumping at all. Rather most of the barbule and finer structures are no different then a white feather but occasionally, in a regular fashion, some pigment does leak from the forming barb into the barbule. Most of the time no pigment at all leaks into the forming barbules. The result is an associated small number of pigment granules where such leakage happens and the rest of the fine feather structure remains pigment free. If the pigment in these associated groups of granules were spread evenly throughout the barbules I doubt if any color difference at all would be noticed by the naked eye. In fact, I have looked at a feather, which to the naked eye looked pure white, and found occasional pigment granules in the barbules.
In the tips of the primary flights and in the tail bar the pigment granules are considerably smaller and cannot be resolved by optical microscopy. Based on the limits of optical microscopy these granules are too small to observe by any known optical techniques. Further detail will require one of the electron microscopy techniques.
Lloyd-Jones3 interpreted some of these areas as having rod shaped pigment granules. I see no compelling reason to invoke rod shaped granules. I do see things that look much like Lloyd-Jones’ drawings in his paper, but feel a better explanation is simply a large number of granules arranged in a more or less linear fashion and with spacing too small to allow resolution. On the other hand, in other cases the perception of rods is due to your eye playing tricks on you and seeing order when there is no real order.
Several black-pigmented, spread pigeons were also examined during this work. Areas examined corresponded to areas that would be blue on a non-spread bird. In all cases the pigment was very dense and in such tiny granules that they could not be resolved. Therefore, Hollander was correct when he said, “spread simply takes the tail bar and spreads it over the whole bird.” He was obviously correct on a macroscopic level. He was also correct on a microscopic level.
A Short Primer on the Limits of Optical Microscopy: A few words about the limits of optical microscopy are probably in order at this point. The maximum useful magnification that can be achieved is determined by an optical factor associated with the objective lens used in any observation. This optical factor is called numerical aperture. The objective lens is the lens at the bottom of the scope that gathers the light from the sample. Any quality objective will have a numerical aperture stamped on the lens. The numerical aperture sets the limit on the useful magnification of the whole microscope. The maximum useful magnification that can be achieved with any objective is 1000 times its numerical aperture. The best objective that can be made could in theory have a numerical aperture of 1.5 and thus would give a maximum useful magnification of 1500X. In practice very few objectives, if any, give useful magnifications above 1300X.
When doing photographs through a microscope the magnification of the scope is of less importance than when looking directly. The reason is a photo can be cropped and blown up resulting in large magnifications. Every photo in this report is blown up well beyond the point where useful magnification is long since past. This does provide ease of view so is handy. However, it must be realized that such excessive magnifications do not allow any extra information content beyond some lower limit set by the objective.


Figure 1. 100 X picture blown up to 1000X Figure 2. 430X picture blown up to 1000X
Any attempt to magnify to a greater extent than defined by the limits of the objective gives what is called “empty magnification.” Empty magnification is simply magnification that has no more information content than a lower magnification. This concept of empty magnification is well illustrated with pictures shown above of blue areas.
Look at the two figures labeled 1 and 2. These two photos were taken with different objectives but are exactly the same area of a feather. For Figures 1 and 2 the objectives used were adequate to support magnifications of 250X and 660X respectively. Actually, the eyepieces used gave magnifications of 100X and 430X. Both pictures were then blown up and cropped in Photoshop to give pictures that have effective magnifications of a few thousand. The blobs of pigment in Figure 1 are considerably less defined than those in Figure 2. The pigment granules in both cases are simply too small for either lens to fully resolve them. I will show pictures latter in this paper that were taken with an objective capable of 1250X magnification. You see lots more fine detail in those pictures than you do in Figures 1 and 2. It is critically important to recognize this type of limitation in optical microscopy or it is easy to look at the blobs of pigment in either of these figures and decide that pigment granules are sort of rod shaped. As I will show latter in this report, the pigment particles shown in Figures 1 and 2 are actually as round as billiard balls at the resolution limits of optical microscopy.
The larger pictures presented in this paper all have about a 18 cm diagonal on the screen I am using. Yet the maximum information content with the lens system I used would only allow a picture with a 1.25 cm diagonal. For ease of viewing, it is nice to look at a bigger picture so I blew them up to the presented size. While this is perfectly legitimate, you must remember that from an information content standpoint, which is the same as saying from a resolution standpoint, most of these pictures are empty magnification. In the several pictures (later in this paper) we can easily see well defined, individual pigment particles at 970X and from the size one would logically think it would be easy to see them if they were half as big. In reality with a lens system providing resolution equal to 660X we do not see them as individuals at all.
Throughout this paper, I have labeled pictures with the magnification at which they were viewed with naked eye through the eyepiece. After the photographic blowups, they are really magnified much more than the listed amount. For pictures with listed magnifications of respectively 100X, 430X and 970X, the actual maximum useful magnifications are 250X, 660X and 1250X.
Results: A feather4 is a wonderfully complex object. It consists of a center shaft often called the quill but whose proper name is the rachis. Off this center shaft are many side shafts called barbs. Each barb has a great many side shafts of it own called barbules. And each barbule has many side shafts that are more or less hook shaped called barbicels. The barbicels between adjacent parts of the feather intertwine their hooks and give the feather the structural stability so it acts as a unit rather than as independent bits of fuzz. Where barbicels are absent, such as on the inner part of the body feathers, the feather is fluffy.
In this work, single barbs were removed from the rachis and permanently mounted in epoxy resin under a cover slip. The two lower magnifications were performed directly on such prepared slides. For 970X magnifications microscopic immersion oil was placed on the cover slip before rotating the objective onto the sample. Thus, there was no air path at all between the sample and the lens of the objective. This is an essential technique to allow such high magnifications.
To put the sizes in perspective the diagonal corner-to-corner distance in the 100X photos corresponds to 0.1mm. For 430X magnifications this distance is 0.023 mm and for 970X it is 0.01mm. Colors are more or less accurate with respect to what the naked eye sees when looking through the microscope. The light source used is tungsten so both the eye and the camera sees extra red. The camera was set to correct tungsten to white light
Pictures were taken of four different areas. Blue was sampled from the blue area on one of the center secondary flight feathers. Blue in the tail looks the same as blue in secondary flights. Bar pictures were taken from the same secondary flights. The tail bar came from a center tail feather. The fourth area sampled was close to the end of the eighth primary flight feather. Each of these areas will be discussed in the above sequence.
Blue: The blue area turns out to have much less pigment than any other area examined. Almost all of the pigment present is distributed in the barb itself. Due to the thickness of the barb structure, it is difficult to look at this area at higher magnifications and get much meaningful data other than to say that it is solid, fairly uniform gray in color and pigment seems to be widely and uniformly dispersed. The cell structure on the surface of the barb is clearly visible.

Figure 3. Blue Area at 100X
To get decent data on the actual pigment distribution in the barb would require thin sections and is beyond the capability of the equipment I have at my disposal.
As can clearly be seen in Figure 3 the amount of pigment distributed on the barbules is not equal on both sides of the barb. As oriented above, barbules on the left side have much more pigment than those on the right. In addition, the pigment coverage is not even close to being solid. Considerable portions of the barbules have no pigment and are simply colorless other than the edge diffraction lines from the feather structure due to optical artifacts. Lloyd-Jones pointed this out in his pioneering paper on the pigments found in pigeons.
Lloyd-Jones proposed that we see this feather as blue, at least in part, due to diffraction effects resulting from the non-uniform deposition of the pigment. The black barbs with small regular separations act as a diffraction grating. It has been clearly shown and well documented in numerous sources that the blues seen in birds are all due to such optical diffraction effects even if all pigment present is black. I see no reason at all to argue with his conclusion. While no one would call the blue in pigeons a bright blue, we still do see it as having a blue hue. At least we have convinced ourselves we see it this way.

Figure 4. Blue Area at 430X
The 430X magnification picture in Figure 4 shows a bit of both the barb and the attached barbules. At this power, we can almost see individual pigment granules. Again, it is apparent that almost all of the pigment is in the barb itself.

Figure 5. Blue Area at 970X
Figure 5 shows a portion of the same blue bar area at 970X. At 970X the depth of field in optical microscopy is tiny. Thus, it is necessary to focus on a specific feature that is of interest. As the primary topic is pigment, I focused on a single group of pigment granules in one barbule just outside the barb. The shadow of the barb can be seen to the right. It is below the focal plane and thus no detail is shown. Several other groups of pigment particles can also be seen, all out of focus. This picture shows that in this area the individual pigment granules are tiny round ball structures. About 30 to 50 pigment granules are in each group. These pigment granules measure about 1 micron in diameter. This is in decent agreement with the diameter reported by Lloyd-Jones. A word of caution is in order concerning the color of these pigment granules. In the picture, or with the naked eye looking through the scope, they do not appear black and in fact, many seem to have clear centers with darker edges. This is an artifact of the high magnification as well as the fact that these pictures were taken in transmitted light. Due to the granules small size light diffraction effects can cause the color seen to change dramatically as the focal plane is changed. The only way to judge true colors is in reflected light observations at much lower magnifications. Reflected light observations at 100X show the pigment to be black indeed.
The pictures in Figures 3, 4 and 5 were taken from a barb which was about 0.5 cm proximal to the bar area of the feather. A second sample was taken just above the fluffy part at the base of the rachis. In this sample, the pigment was considerably different in distribution. Rather then being in small groups of granules the pigment was in very thin extended lines with random lengths oriented in the same direction as the barbule or barbicle that contains them. The L/D ratio of the longer lines is probably at least 100. These lines of pigment are smaller in diameter than the individual pigment granules shown in Figure 5. They are small enough that I really cannot get a reliable diameter measurement. On occasion individual pigment granules were seen. The granule size was well below those seen farther out on the feather and too small for me to measure. These individual granules seemed to be round. Lloyd-Jones interpreted what he saw in these areas as rod shaped pigment particles. I do not5, 6. I think a better interpretation is that these lines are a large number of very small individual granules so close to each other that individual granules are not resolved. Others have reported such structures in mammals.
Wing Bar: Figure 6 is of the bar region from a sample taken from a center secondary flight at 100X magnification.

Figure 6. Bar Area at 100X
Contrast this picture with the blue area at 100X magnification (Figure 3). The big difference seen here is the bar area simply has much more pigment in the barbules than the blue area. The barb itself is also more pigmented. In fact, the barb has so much pigment that little light is being transmitted and the cell structure is not distinct as it is in the blue areas. And the barbules on both sides are solidly pigmented from the barb to the tips. In fact, pigment is even getting out into the barbicels so they can be seen. No pigment at all was seen in the barbicels in blue areas. These qualitative observations are in agreement with Haase and Sell’s7 quantitative studies that showed the bar area had about six times the total pigment, for a given weight of feather, compared to the blue area.

Figure 7. Bar Area at 430X
Figure 7 shows this same sample at 430X magnification. The picture was taken on the right side of the barb shown in Figure 6. The area shown is the outer edge of the total structure. There simply is so much pigment that only in the very tiny feather parts are granules separated enough to see them as individuals. On the very right side some hints of individual pigment granules can be seen. The linear order seen in these granules is forced onto them by the tiny feather structures.

Figure 8. Bar Area at 970X
Figure 8 was taken close to the right edge of the area shown at 430X. Again, it was picked as an area that had little enough pigment to allow individual pigment granules to be visualized. The feather structures that hold the pigment are the barbules or barbicels. Thus, the pigment tends to be in strings of particles rather then groups as it is in blue areas. The pigment is in strings due to the tiny size of the structures. The pigment granule size is somewhat smaller, but still round, versus what was observed in blue areas. In addition, the pigment granules are not all the same size as they are in blue areas. A few come close to being as big as those in blue areas while others are well below this size. I estimate an average granule size of 0.7 microns in this sample. The biggest difference observed between the pigment in the blue area and the bar area is much higher concentrations of pigment in the latter.
Tail Bar: The tail bar, shown in Figure 9, has even more pigment then the wing bars based on the intense black color seen. The barb is so pigmented that no light is being transmitted at all. All structural detail in the barb is lost compared to the blue or wing bar pictures. In the tail bar, the pigment is even very concentrated in the barbicles.

Figure 9. Tail Bar at 100X
Figures 10 and 11 shows the tail bar at 430X and 970X magnifications respectively. So much pigment is present that minimum detail can be seen. At 430X the barbules are dead black so little light is being transmitted. And even the base of the barbicels is black. The 970X picture was taken of the area between the two barbules that end in the upper right corner of the 430X picture. As can be seen the pigment particles are not resolved. A few objects are about the expected size of pigment particles. However, these do not give the crisp image seen earlier. And there are large areas that show color but no real detail. Focus changes lessened the already poor detail.


Figure 10. Tail Bar at 430X Figure 11. Tail Bar at 970X
This was a surprise. My interpretation is that the pigment granule size in this area is reduced well below the resolving power of my microscope. It would not take a large particle size reduction to drop below my resolving power. As can be seen in prior pictures on going from 430X to 970X granules went from being only hints too easy to see. A reduction in granule size of a factor of about four from those seen in the blue and bar areas would exceed the resolving power of my best lens.
Close to the End of the Eighth Primary Flight: Figure 12 shows this area at 100X magnification. This area does not look nearly as intensely black to the eye as the tail bar. It does not look as black in the microscope either. However, microscopically it does look more pigmented then the wing bar. Like the tail bar the barb itself is so intensely pigmented no detail is seen.

Figure 12. Primary Flight Close to Tip
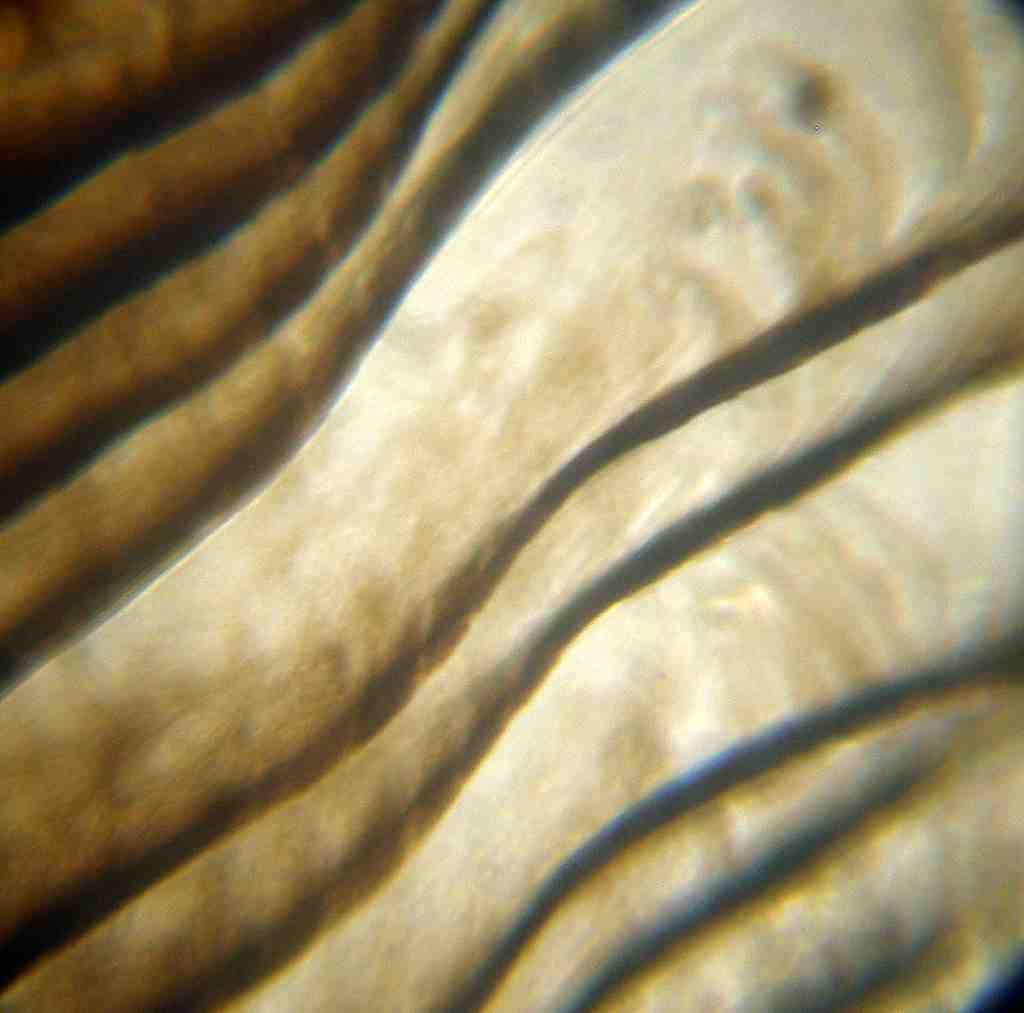

Figure 13. Primary Flight 430X Figure 14. Primary Flight 970X
The higher magnifications, shown in Figures 13 and 14, of the flight tip area are much the same as seen in the tail bar except the pigment concentration is not as high. The barbules are so intensely pigmented that no real detail can be seen other then outline shapes at 430X. At 970X some granularity is present that likely is not due to pigment, but rather is due to the surface structure of the barbicels. A key point is whatever is governing the pigment size happens in both the tail bar and the end of the primary flight just as Hollander suggested.
Chest Feathers: Examination of chest feathers showed the pigment present had granule sizes very much like those found in the wing bars. Pigment density was very high as might be expected from the naked eye color of this area. To resolve individual particles only very tiny structures could be examined. The barb examined was taken from the non-fluff part of the feather.
Experimental:
Bird Used: The bird used was band number AU 2032-00. This bird was a blue bar with the standard white under wing and rump feathering. It had a clearly defined albescent strip and was not hetero for smoky. It showed no pied feathers or visible bronzing. The breed was Racing Homer. It was a cock bird.
Slide Preparation: A single barb with attached structures was separated from the neighboring parts on the feather by passing needlepoint tweezers between the adjacent barb shafts from the rachis to the end of the barb shaft. The barb shaft was gripped by tweezers right at the base where it attached to the rachis and torn free. The last 2 mm of the proximal end of the barb shaft was cut off with a honed exacto knife.
Embedding resin was prepared from Z-POXY finishing resin (a product of Pacer Technology) mixed with 95% ethanol in a ratio of two parts resin to one part alcohol. A few drops of the resin alcohol mix were placed on a slide, and the barb shaft was carefully placed on the resin with the plane of the barbules the same as the plane of the slide and the convex side of the whole feather structure up. This needs to be done as gently as possible to avoid trapping air under the feather parts. Very gently, the feather sample was pressed into the resin mix with a toothpick. This needs to be done as slowly as possible to assure good wetting and the fewest trapped air bubbles. It is also important to move the structure as little as possible to avoid inducing great disorder in the smaller parts of the feather.
A cover slip was placed over the resin puddle at an angle and slowly allowed to contact the resin surface and wet out. The cover slip was allowed to set a few minutes then clamped to the slide with a standard household plastic clothespin. If pressure is applied slowly, the feather sample will stay in place while excess resin flows out the edges of the cover slip.
After curing 8 hours excess resin around the cover slip can be removed with a sharp exacto knife.
Microscope: The microscope used is a binocular AO Spencer serial number 332323 manufactured in 1937. This scope has an extensive sub stage light focusing system equipped with an adjustable diaphragm and a micrometer movable stage readable to 0.1 mm. Three objective lenses were used. The low power objective is a 10X lens with a numerical aperture of 0.25. The mid power objective was a 43X lens with a numerical aperture of 0.66. The high power objective was a 97X oil immersion lens with a numerical aperture of 1.25. The eyepieces used were 10X.
The immersion oil used was Jorgensen Laboratories Inc type J-326A oil.
Camera: Photographs were taken with an Olympus model SP-360 camera. The camera was positioned over the scope and held steady in a home built wood stand which positioned the camera lens about 3mm above the right eyepiece lens of the scope. The camera was locked at infinity focus and 2.8 F stop. The camera light meter was set to read the center of the field of view and adjusted exposure time automatically. The cameras internal software compensated for the tungsten light source correcting it to white light.
Photograph Processing: Photo data was downloaded into Google’s freeware package named Picasa2. Picasa2 was used to crop the pictures to remove the field of view outside the eyepiece. Also photo resolution was degraded a small amount by the camera from the view seen by eye through the microscope. Picasa2 was used on each photograph to apply one level of sharpening to return the picture to the quality image seen by eye. Picasa2 was also used to reduce the bits to a reasonable level of roughly 40K from the raw image. This reduction in bits did not result in any loss of detail in the image.
References:
- W. F. Hollander, Origins and Excursions in Pigeon Genetics, pg 133
- W. M. Levi, The Pigeon, 1963, pg 310
- O. Lloyd-Jones, Studies on Inheritance in Pigeons, Journal of Experimental Biology, (18) 453-509, 1915
- http://fsc.fernbank.edu/birding/feathers.htm
- D. Clive and R. S. Snell, Effect of alpha melanocyte Stimulating Hormone on Mammalian Hair Color, J. Invest. Derm., (49) 314, 1969 - This paper shows optical pictures of melanin granules in guinea pigs. The granules are perfectly round.
- F. H. Moyer, Genetic Variations in the Fine Structure and Ontogeny of Mouse Melanin Granules, (6), 43-66, 1966. This paper shows results from scanning electron microscopy studies on various mouse hair color mutations during granule formation. Both eumelanin and pheomelanin granules were examined. Granules are shown to form from folded protein sheets with the melanin deposited on active sites within those proteins. Wild type black granules are ellipsoids about 0.5 micron wide X 1 micron long that the authors described as rod shaped. Most color mutants are spheres from a few tenths of a micron to almost 1 micron diameter. The density of deposited melanin was shown to differ greatly depending on the mutant examined.
- E. Haase, S. Ito, A. Sell and K Wakamatsu, Melanin Concentrations in Feathers from Wild and Domestic Pigeons, Journal of Heredity, 83(1) 64-67, 1992