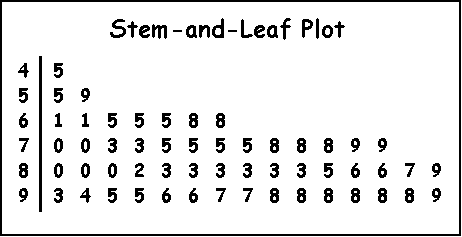
After a recent test, Mrs. Parker created
the following stem-and-leaf plot to display the scores of the students
in two of her math classes.

1. How many students are in the two classes?
2. Fine the range, mean, median, and mode of the data?
3. Create a box-and-whisker plot from the data.
4. Describe the steps involved.
5. What do you think of the test scores?