What are "bands" and how are they interpreted?
[Click
Here for Composites]
Student Activity
for Subject/ Grade Level:
Grade 9 Earth and Space Integrated Science
by Sister Marie Dianne, Bishop O'Connell High
School
[Questions adapted from:
Earthshots and MultiSpec
GLOBE training file ]
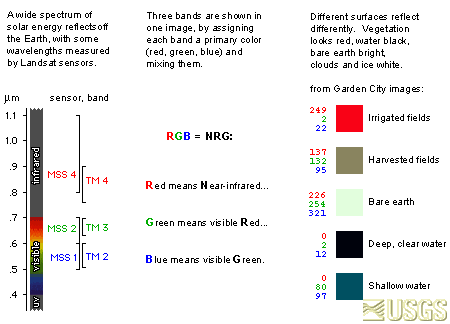
[ This
color chart is from the USGS's Earthshots Website.]
1. What is
Earthshots and where does it come from?
2. What do the colors
tell
us?
3. In a RGB display, each
color pixel has a level
of intensity which varies from 0 to ____ (what number?).
4. What do these abbreviations
stand for?
a) EMR =
b) ETM+ =
c) TM =
d) MSS =
B. The MSS and TM are optimized to detect
and monitor certain types of reflectance.
1. What is the MSS band 1 (&
TM band 2) particularly good for detecting?
2. Which MSS (& which
TM) bands are made to detect chlorophyll absorption in vegetation?
3. Water-land boundaries
show up best in which bands for MSS (and which for TM)?
4. To distinguish between
forests, why is the TM band 1 particularly helpful?
5. Which TM band is good
for detecting heat?
6. If in an image, all
values of all 3 colors are very high, what color would that area appear?
C. Spectral Signatures
1. What is a spectral signature?
2. Healthy vegetation absorbs
VISible light (especially red light) and reflects Near InfraRed, so why
is the NDVI (="normalized difference vegetation index") helpful?
D. Interpretation: You try it!
1. Which image shows more population
growth: Left or Right? [One is from "4/86; other is from
1/00 Can you explain any of the colors?]

Orlando "86 |

Orlando"00 |
2. Can you tell if there
has been a change in irrigation? What colors might give you clues? [Click
on photos to zoom in..]

SW blue-gray =Cairo, Egypt near
the Nile River "73 |

Same area of the
Nile River "87 |
3. How has this area changed
from 1972 to 1988? Can you explain? [Can you see any evidence
of irrigation circles?]

Garden City, Kansas, 1972 |
Garden City, Kansas,
1988 |
Purpose:
To use remote sensing, geographic information systems (GIS), in-situ
measurements, and modeling to investigate Human Impact on Near-surface
Atmosphere
State/ National Education Standards
and Benchmarks Addressed by this Lesson:
Abstract:
Students will be introduced to Remote Sensing Imaging of Thermal Data in
order to investigate whether growing amounts of Impervious Surfaces in
the Baltimore-Washington D.C. area are causing an increase in local atmospheric
temperatures.
5E
Lesson Model


 Bye for now, and Thanks for joining us !!
