
MATLAB RESULTS
The following Matlab figures were generated by the code listed in the Matlab Code Appendix.

Figure 1: Time Domain Speech (utterance) Signal
Figure 1. shows the time domain speech signal for the utterance "Please Do This Today". This speech signal consists of a periodic(vowels,voiced), as well as impulses(plosives) and noise(unvoiced) components. We can see that the utterance lasts for about 2.3 seconds. This means that the length of the utterance in samples is (8000*2.3) = 18400 samples.

Figure 2: Typical Windowed Speech Waveform
Figure 2. shows a typical windowed section of the speech utterance from Figure 1. We see that the length of each window is (8000*.025) = 200 samples.
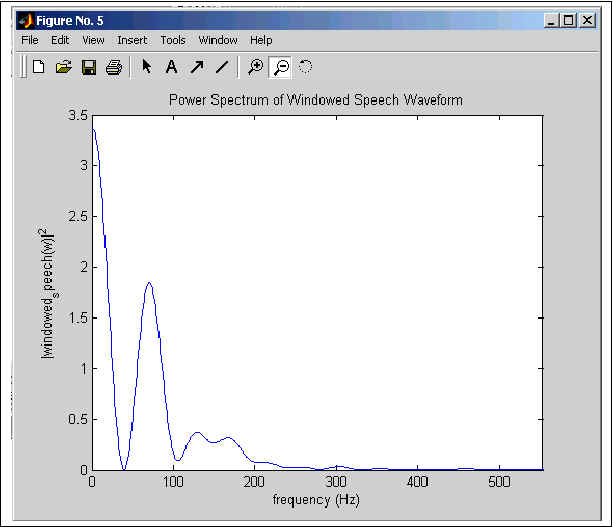
Figure 3: Power Spectrum of Windowed Speech Waveform
Figure 3. shows the power spectrum (energy) of the typical windowed speech waveform of Figure 2. The TMS 5220 speech synthesis chip uses this information to control the amplitude of the excitation(glottal--voiced, noise--unvoiced) which is then sent through the lpc lattice filter to produce the speech waveform. More specifically, the amplitude of the excitation controls the 'volume' of the speech output.
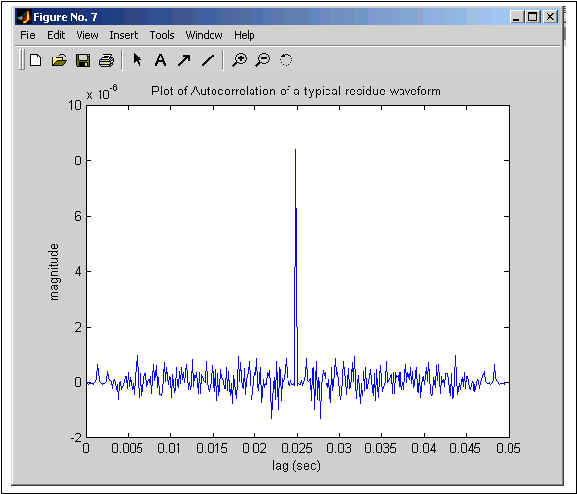
Figure 4: Autocorrelation of Typical Residue Waveform
Figure 4. shows the autocorrelation of a typical residue(excitation) waveform. This autocorrelation is used to find the pitch of the excitation. The pitch frequency is found by taking the inverse of the time difference between the 0 lag (largest peak) and the second largest peak. Specifically, the pitch frequency is 1/(.033-.025) = 125 Hz. This value for pitch frequency makes sense since the speaker of the utterance was a male. A tyical male has a pitch frequency of 120 Hz. The TMS 5220 speech synthesis chip uses this pitch information to control the pitch of the excitation(glottal--voiced, noise--unvoiced) which is then sent through the lpc lattice filter to produce the speech waveform.

Figure 5: Typical Residue (Excitation) Waveform
Figure 5. shows the typical residue (excitation) waveform which was extracted from the speech waveform by inverse filtering a typical windowed speech waveform with the LPC model of the vocal tract. Notice that the excitation of Figure 5. looks like an impulse train, which is what it should be. The TMS 5220 speech synthesis chip would take this excitation along with Energy from Figure 3. and Pitch from Figure 4. to produce a scaled excitation which is then sent through the lpc lattice filter to synthesize the speech waveform.
