

A Collection of Charts
The below collection of charts shows the various ways pH nutrient availability is portrayed by those who've created the charts. Notice how some are not labeled to distinguish between soil and soilless environments. Soil charts were the only ones available when some early hydroponic nutrient availability resources were published, consequently many soil charts still erroneously appear in many soilless or hydroponic internet resources and books.
As the Combo charts best depict, there is a vast difference in nutrient availability between soil and soilless growing environments. Most soil and soilless references are consistent across the charts with the exception of Soil#2 and Hydro#1, which seem to be comprised of a mix of values taken from both of the more popular soil and soilless charts.

Soil#1

Soil#2
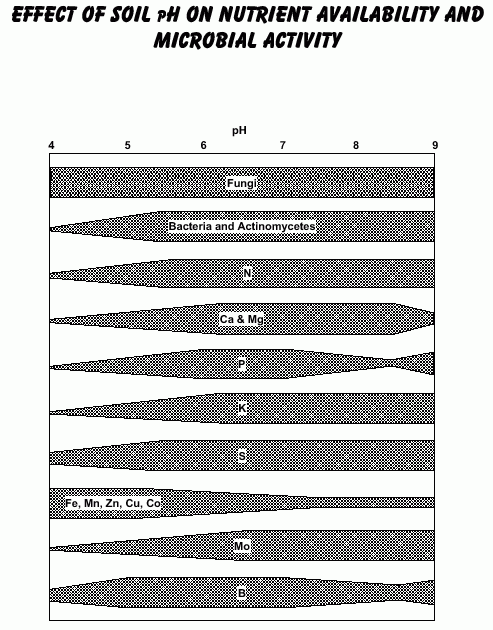
Soil#3

Soil#4

Soilless#1

Hydro#1

Combo#1

Combo#2

Combo#3
![]()
