|
|
Swings and Roundabouts: What Really Happened on May 6 A Report on the First Welsh Assembly Elections [With Ed George; November 1999; Welsh Labour Action Pamphlet No. 1] 3. Labour and Plaid's Returns: 1999 and 1997 Compared 5. The Swing From Labour to Plaid 6. Parties to the Left of Labour and Plaid This report is an attempt to look beyond the spin at what really happened in the first Welsh Assembly elections on May 6, 1999. We look at the voting figures on a national and constituency basis, and go on to study the extent and nature of the swings from Labour to Plaid Cymru. The Assembly elections and the Euro elections which followed in June are then set in their historical context. The last part of the report examines the various explanations which have been offered for Labour's poor performance. We discuss them and offer our own interpretation of the results. The report was first presented to a meeting of Welsh Labour Action in June. It was submitted to the Debriefing Team established by the Labour Party Welsh Executive to look into the Assembly election results. Following its initial distribution, we received considerable positive feedback on its contents and suggestions for improvements. We have incorporated these into this final version and are grateful to all those who contacted us. The main thrust of our arguments can be summarised as follows: Our analysis shows very clearly that the biggest swings from Labour to Plaid Cymru were in the south Wales valley constituencies which make up Labour's traditional heartlands. Local factors may have had some influence in the Rhondda and Islwyn but this does not explain the huge swings across the whole south Wales valleys. We are seeing myth-making on a grand scale in the explanations being offered for these results. The first grand myth is that the two leadership contests were the cause of Labour's poor showing. In reality, it was not the contests but the undemocratic way in which they were conducted, and the eventual outcome, that cost us votes. We have not met a single party member, or a member of the public, who objected to the leadership being contested: what they did object to, particularly with the second contest, was the blatant stitch-up engineered to ensure that Alun Michael won. The second grand myth is that Labour failed to get its message across. Peter Hain has argued that Labour is implementing a radical socialist programme on the quiet but that the core vote in Wales failed to realise this. If the Labour Party really was implementing such a programme, which was making a real difference to people's lives, then there would be no need to spell it out to Labour voters. The truth is that Labour voters in Wales understand only too well what the Labour government is doing and they don 't like it. This is why hundreds of thousands of Welsh Labour voters did not vote in the Assembly and Euro elections and why tens of thousands of them switched to Plaid Cymru. You may not, as yet, be convinced of these points. We hope that you will be after reading the report. Ceri Evans and Ed George November, 1999
1.1 Percentage of votes cast for the main parties, and Assembly seats won.
Comments 1. Note the similarity between the first and second votes for each party. Despite some predictions to the contrary, most voters tended to vote for the same party on both ballots. 2. With the exception of the disastrous result of 1983, this is the lowest Labour share of the vote in Wales since 1918. As far as the Conservatives are concerned, the European election of 1994, the general election of 1997, and now the Assembly election, mark by far their worst performance in Wales since the appearance of anything resembling the modern Conservative Party in 1832. The Liberal share of the vote held up. Plaid’s return gives them their highest share ever - by a very long way. 3. The strange, hybrid electoral system we found ourselves landed with did in the end achieve a fair degree of proportionality: largely a product of the fact that Plaid gained so many constituency seats. However, as can be seen, the real gainers from the system were the Tories, with a nine-fold increase in seats. 4. Of course, since the overall turnout was so low, looking at the percentage share of the votes does not tell the whole story. We need also to take a look at the total numbers of votes cast ...
2.1 Total votes cast: 1997 and 1999 compared.
Comments 1. From table 2.1, we can see that on a national basis, Liberal, Conservative and - in great numbers - Labour voters stayed home. 2. The turnout may have been low overall, but the total number of Plaid votes cast is up 80 per cent compared to 1997. Their previous highest share of the vote (17.1 per cent in the 1994 European election) and their previous highest total number of votes (175,016 in the 1970 general election), were both far and away surpassed. 3. Thus it is on a national scale. Now we need to look at the election at the level of the constituencies ...
3. Labour and Plaid's Returns: 1999 and 1997 compared 3.1 Labour and Plaid's returns: 1997 and 1999 compared.
Comments 1. The Labour vote was down in every seat in Wales. 2. In 1997 Labour's share of the vote was greater that 60 per cent in 15 Welsh constituencies. In 1999, the share remained higher than 60 per cent in only two: Blaenau Gwent and Cardiff West. The only percentage increase in the Labour vote - of 1.3 per cent - was in Cardiff West. Yet even here, the Labour vote was down by 41 per cent. 3. The Plaid vote was up everywhere, except in two of the seats they hold at Westminster: Ceredigion and Merionnydd Nant Conwy. 4. In 1997 the Plaid share of the vote was above ten per cent in only ten constituencies; in 1999 there were only two constituencies where it remained in single figures: Monmouth and Brecon and Radnor. 5. The safest Assembly seat belongs to Plaid Cymru: Dafydd Wigley's seat in Caernarfon. The safest Labour seat is held by Rhodri Morgan in Cardiff West. Who would have predicted this a year ago?
A comparison is made of the voting figures in 1997 and 1999 for the five constituency seats gained by Plaid. The method used to calculate the swing is explained in Section 5 below. 4.1 Islwyn
Swing (Labour to Plaid): 25.0 %
4.2 Rhondda
Swing (Labour to Plaid): 24.0 %
4.3 Llanelli
Swing (Labour to Plaid): 14.4 %
4.4 Conwy
Swing (Labour to Plaid): 10.7 %
4.5 Carmarthen East and Dinefwr
Swing (Labour to Plaid): 9.8 %
Comments 1. In Carmarthen East and Dinefwr, Llanelli and the Rhondda, Plaid were second in 1997. 2. Despite Plaid being fourth in Islwyn in 1997, the Rhondda and Islwyn results in 1999 are in fact quite similar:
The result: a massive swing from Labour to Plaid in each case, of a roughly similar magnitude. Simple logic tells us that in Rhondda and Islwyn large numbers of former Labour voters must have voted Plaid. 3. In Llanelli, the Plaid vote increased by a little over 4,000 in 1999: in Carmarthen by a little under 3,000. In Llanelli, the Labour vote collapsed, as opposed to merely doing badly as it did in Carmarthen. Perhaps the realtively small size of the Labour majority in Carmarthen in 1997 (3,500) compared to that in Llanelli (16,000) provides an explanation. 4. Conwy was a three-way marginal in 1997 with Plaid not even in the running. Yet the dramatic surge for Plaid resulted in the fourth-placed party in 1997 taking the seat. 5. The point needs reiterating. The results above demonstrate that, in large numbers, former Labour voters must have voted Plaid. This is confirmed by a NOP opinion poll conducted for HTV, which showed that 38 per cent of Plaid voters switched from Labour. 6. It is difficult to discern a general pattern in the five Plaid gains. In order to see if a pattern is discernable on a national scale, it is worth comparing the swing from Labour to Plaid on a constituency by constituency basis...
5. The Swing From Labour to Plaid The coalfield area of the south Wales valleys has historically been the repository of a concentrated Labour vote practically without equal in Britain (the only other areas that begin to compare with it in political character are 'greater' Merseyside and 'greater' Glasgow). If, as we suggest, the surge in the Plaid vote is the result of a protest vote on the part of traditional Labour voters, it is in this region that its effects should be expected to be most sharply visible. The following key has therefore been adopted in the table below:
By 'semi-coalfield' constituency, what we mean is either a constituency immediately adjacent to the coalfield itself which incorporates a part of the coalfield within its territory (e.g. Gower), or a constituency immediately adjacent to the coalfield which is notably similar in socio-economic profile (e.g. Swansea East). A word on methodology: the swing has been calculated using the standard simple swing calculation (often called the 'Butler' formula, after its inventor), but with the modification that instead of using as raw data the percentage share of the vote for each party expressed as a percentage of the total votes cast, the raw data we have used is the percentage share of the vote for each party expressed as the percentage share of the electorate. The reasons for this should be clear from sections 2, 3 and 4 above. While the overall turnout in the election was low, the parties were not equally effected by it. Indeed, one of the unique phenomena of this election is the fact that alone of the parties the Plaid vote, in absolute terms, is up very substantially. By calculating the swing in this way, the turnout becomes a factor in the overall swing, along with the change in votes for each party.
5.1 Constituencies ranked by size of swing From Labour to Plaid in descending order (using as raw data votes cast as percentage of electorate)
Comments 1. The coalfield and 'semi-coalfield' constituencies stand out in sharp relief at the top of the table, with the Plaid gains in the east and central coalfield registering the largest swings. Note also the non-coalfield south Wales constituencies which register in the top half of the table: the Vale of Glamorgan, Bridgend, Swansea West, even Newport West (but not Cardiff). Here the two features of the Labour voters' protest - a large abstention plus a smaller but still very significant positive vote for Plaid - is most sharply expressed. 2. The bottom of the table contains the four Plaid and two Liberal seats won in 1997. In the former case, as we can note from section 3, the Plaid vote did not display the huge rises we can see elsewhere, but still more or less held up (itself a better result than any of the other parties). In these constituencies, the Labour vote is badly down in absolute terms (by between 33 and 50 per cent), but, compared to the coalfield at least, is in relative terms merely dreadful rather than catastrophic. In the 1997 Liberal seats of Montgomeryshire and Brecon and Radnor, the Plaid vote is up substantially, and the Labour vote has collapsed, yet both parties start from a relatively small base of support in 1997, and consequently do not register high in terms of swing, since we are only dealing with relatively small numbers of votes. 3. We can see that the five Plaid gains are spread fairly evenly across the table. In Llanelli, Conwy and Carmarthen East, Labour's 1997 majority was sufficiently small, and/or Plaid's 1997 base was sufficiently large, for a relatively small (but still huge under 'normal' conditions) swing to be sufficient to take the seat. The point is this: in most of the other south Wales seats in the top third of the table, Plaid have come from virtually nowhere in 1997 to being a strong second party in 1999. These seats are not quite 'marginals' yet, but the position Plaid enjoys in 1999 would have been difficult to conceive of on the basis of a study of the 1997 vote. 4. This table gives the lie to the idea that local factors were mainly responsible for the Plaid gains in the Rhondda and Islwyn. Local factors may have ghelped to tip these seats over the edge but huge swings were recorded across the whole south Wales coalfield. 5. In many ways, this is the most important table in the report and goes a long way to explain what really happened on May 6.
6. Parties to the Left of Labour and Plaid The United Socialists, the Socialist Labour Party and the Communist Party stood on platforms to the left of both Labour and Plaid Cymru.
United Socialists
Socialist Labour Party
Communist Party
Comments 1. Given the complete lack of either a campaign or a party organisation the SLP did relatively well. 2. The United Socialists did very badly in the regional votes, but fared a little better in the constituency votes. 3. Having noted all this, it is clear that - even taken together - these results indicate that, unlike Scotland, there is no political space of any significance to the left of Labour and Plaid. The Labour protest vote went overwhelmingly to Plaid and not to its left.
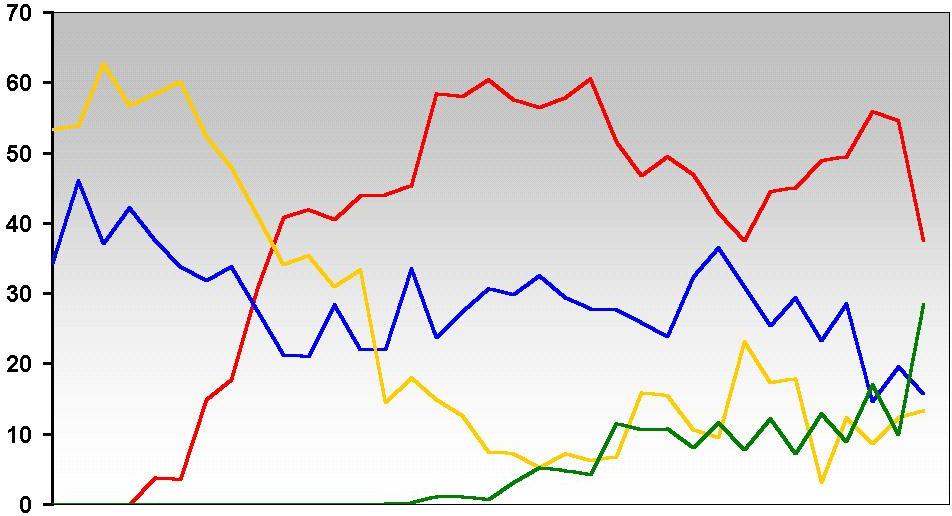
It is important to place these results within a historical context: the graph shows the percentage share of the vote for each of the four main parties, from 1885 to 1999. The actual figures on which the graph is based are listed in Appendix A below. 7.1 All Welsh national elections since 1885: percentage of votes cast for the major parties
Comments 1. It can be seen that from the end of the Second World War to the end of the 1960s the Labour Party achieved a degree of electoral dominance equivalent to that of the Liberals over the latter half of the nineteenth century. From the 1970s, Labour's share of the vote is proportionally similar to the 1920s and 1930s. The two 1999 results pose questions with regard to long term trends that wlll only become more clear following the next British general election. 2. From the peak of the early 1970s, Plaid's share of the vote in British general elections has hovered below 10 per cent, although Plaid fares notably better in European elections. It is against this backdrop that 1999 is so remarkable. Again, we await the next British general election with interest. 3. The Liberals, from the near hegemonic position they enjoyed over the latter half of the nineteenth century, have, since 1945, occupied a rather marginal position in Welsh politics (with the exception of the flash in the pan that was 1983). Interestingly, they significantly under-achieve in European elections, which suggests that rather than being a recognisably distinct national political force, Welsh Liberalism owes much of its actual electoral position to its myopic indulgence in local, 'pavement' politics. 4. The Conservative vote - up until 1994 - is rather interesting on two counts. First, it is remarkably stable, consistently hovering more or less between a fifth and a third of votes cast. Second, it has thus been larger than many people think, suggesting a social base for Welsh Conservatism of some solidity, and giving the lie to any claim that up to the mid- 1990s Wales had in any meaningful sense been a Tory-free zone. The 1999 European election would appear to offer some crumbs of comfort to the Tories, if you look at the share of the vote. But take a look at the absolute numbers in Appendix A. The 1994 European election result was the worst ever result for the Tories; yet in the 1999 European election, while the share of the vote looks relatively healthy, the party gained less that 5,000 additional votes. 5. The historical approach is a useflil one in evaluating the significance of the 1999 European election. We can discern the following patterns:
Once again, Plaid's experience is different. While the number of votes is down on the Assembly election, it - uniquely of the Welsh parties - exceeded the total won in 1994 (and in fact the totals won in every other national election in the party's history bar that for the Assembly).
It seems that ingratitude was a widespread problem in Wales on May 6. As the votes were counted on the following day, it became increasingly difficult for Labour politicians to blame the results on 'complacency' and 'the politics of contentment'. Plaid canvassers campaigning in the south Wales coalfield constituencies during the 1997 British general election reported that a common response from Labour supporters ran along the lines of, 'Sorry, love, we have to vote Labour to get rid of this government; but if we had two votes, we'd definitely give you the second one.' So when the election procedure for the Assembly was unveiled, many predicted that a phenomenon of split voting was likely in many areas. As we now know, this is not how it turned out. Labour voters dealt New Labour a particular double-whammy of a protest vote on May 6. In their hundreds of thousands, Labour voters refused to vote Labour; and in their tens of thousands, Labour voters voted Plaid - in both ballots. While the contours of this voting pattern should not perhaps have surprised us, its sheer scale absolutely did. And while many Labour activists were left, in the words of one, 'feeling crushed' by the experience, the politicians, the pundits, and the spinners began to seek an explanation. But which version are we to believe? Did the Assembly result really herald a new dawn for Plaid in Wales? Was this that much-heralded yet elusive inroad into Labour's heartland vote? Or rather, do we follow Peter Hain, who has suggested that Labour's performance was in fact an unfortunate consequence of the government's approach of 'reform by stealth', resulting in a failure to 'spell out to voters that Labour is following a radical socialist programme'? Or is it the case that Labour's strategy was doomed from the start? That, fatally weakened by two acrimonious leadership contests, an undemocratically imposed leader, and a campaign run by the London-based party apparatus, the tentacles of the Millbank octopus had strangled Labour's prospects from the outset? Each of these explanations, taken by itself, is inadequate. It is urgent that the left in Wales develops an interpretation of the events of May 6 that really explains what happened, and why. The following observations, we would suggest, form a critical element in this task. The Leadership Contests and 'Control Freakery' The leadership contests have been widely blamed for Labour's poor showing. According to Peter Hain MP, the contests showed a divided and inward-looking party, which was unattractive to voters. In our view, the problem lay not with the contests themselves but the undemocratic manner in which they were conducted. Some people will undoubtedly argue that the elections were conducted according to the rule book and that Alun Michael was elected by the same method as Tony Blair. This ignores the fact that different rules were used for each of the Welsh leadership elections - which suggests that the rules are not set in stone - and that the election of Tony Blair involved OMOV ballots in all of the affiliated organisations: a far cry from Alun Michael's case. Of course, blaming the contests or blaming the way the contests were conducted can lead to very different conclusions. If you blame the contests, the obvious solution is to hold as few as possible; if you blame the conduct, the solution is to conduct them more democratically in the future. Hain has also conceded that Labour may have given 'an impression of control freakery' in its pre-election activities. The evidence suggests that this impression was based on fact. Party members were appalled by the procedure used to select the Euro-election candidates, the conduct of the second leadership contest and the selection of the Assembly top-up lists. Control freakery was evident in many aspects of Labour's Assembly campaign: from the printing of leaflets to the orchestration of photo-opportunities. What has not been adequately discussed is why such 'control freakery' was necessary in the first place. The simple answer is that the membership of the Welsh Labour Party could not be relied upon to choose the 'correct' candidates for the job. This 'control freakery' was a symptom of a much deeper political problem, not its cause. Political differences, free debate and elections are, in and of themselves, not the sign of a weak party, but a necessary precondition for a vibrant and a healthy one. The worst thing that we can do now is shy away from debate. The discussion over the events of May 6 and their aftermath cries out for an urgent injection of politics: it is more political debate that we need, not less. We Failed to Get Our Message Across This is one of the main arguments in Peter Hain's celebrated New Statesman interview. He argues that the source of New Labour's troubles in Wales was not its practical programme but the failure to spell out to voters the real benefits of that programme. This argument at least has the merit of acknowledging a political problem for New Labour in Wales, rather than simply blaming the leadership contests for the outcome of the election. Yet, despite his protests to the contrary, Hain deflects the problem from the policies themselves to their presentation. Now, never mind Hain's macho bluster about 'never having been a yes man', this is, make no mistake, the Millbank message for Wales. And it is a message that is both patronising and offensive. If Labour's 'radical socialist programme' really was working for the people of Wales then it wouldn't be necessary to spell it out to them. People would see it and feel it in their everyday lives. Labour voters did not turn away from Labour on May 6 because they didn't know what the New Labour government was doing but precisely because they did. The people of Wales, contrary to Hain, are neither complacent, nor stupid. Valley Voters Have Not turned Nationalist More of an observation than an explanation, this line was used repeatedly by Glenys Kinnock after both the Assembly and European elections. It is certainly true that the shift to Plaid Cymru does not represent a move away from socialism and towards nationalism by valley voters. And why? Because Plaid did not run a particularly nationalist campaign and more importantly, the Labour Party did not run a particularly socialist one either. Why Vote Plaid Cymru? This brings us to the question of why people did vote Plaid. In our view there are two main reasons. The first was the lack of a Tory threat in Wales and the fact that voters were not deciding on the government at Westminster. Most valley voters understand, quite correctly, that the governance of the British state is a straight fight between Labour and the Conservatives. Given such a choice they will naturally tend to vote for a Labour government, whatever their misgivings about the direction of New Labour. On a Welsh level, this pressure did not exist in the same way. Plaid Cymru themselves have acknowledged this factor and according to Karl Davies, Chief Executive of the party: 'Usually in a General Election the swing stops once the campaign gets under way. This time there was a significant swing late in the day. In many ways, it was more similar to a by- election than a general election.' He went on to say: 'In a national by-election, we held all the trump cards. We succeeded in bringing in the presidential element by promoting Dafydd Wigley. The poster showing Alun Michael as a poodle worked because people already believed it.' The second reason for Plaid's success was their policies, which were clearly to the left of Labour on issues such as health, education and welfare. Labour's 'nationalist madness' campaign failed so abjectly because its authors failed to understand that the appeal of Plaid to Labour voters lay not in its 'nationalism' but rather in the perception that Plaid were better defenders of their interests - were, in fact, better 'Labourites' - than New Labour itself Paul Flynn NW spelled this out very precisely: 'Plaid Cymru ... want pensions to be increased by earnings level and student loans to be replaced by grants. The Labour voters of Islwyn, Rhondda and Llanelli found that "insanity" irresistible.' The whole New Labour project was premised on the idea that working class Labour voters had nowhere else to go if Labour moved to the right and embraced many Conservative policies. The reality of what happened in the Assembly and European elections has been well described by Anthony King, Professor of Government at Essex University:
Low Turnout As our analysis has shown, there is little to reassure the Labour Party in these results. The only small comfort that can be drawn is that Plaid's success was based on a very low turnout. There would only need to be a small recovery in the Labour vote to wipe out many of Plaid's gains. It is also possible that some of those who didn't vote did so more out of lack of interest in the Assembly than disillusion with the Labour Party. Such voters could be expected to return to Labour in the next British general election. But it would be very foolish to take any such recovery for granted or to ignore the clear lessons of these results.
Does May 6 thus mark a watershed, a point of no return in Welsh politics? We can only reply that it is 'too early to say'. It is, of course, difficult to imagine the next British general election taking the form of a simple re-run of May 6. Welsh elections and British elections differ in a number of respects. On a Welsh level, no matter how limited the actual powers of the Assembly are, Plaid can present itself as a potential 'party of government' in a way that it cannot in a British election. On a British scale, the vivid and recent experience of Conservative rule at Westminster poses the Tory threat much more sharply, prompting a tendency for the Labour vote to rise at the expense of Plaid. But the next British general election will not be a simple re-run of 1997 either. The question will not be, as it was in 1997, the need to remove a hated Conservative government, but the rather different matter of maintaining in office a palpably hostile New Labour one. It will thus, to put it mildly, be something of a surprise if Plaid does not do significantly better (at the expense of Labour) in the next British general election than it did in the last one. Of course, what will happen at the next British general election is not predetermined. It will depend on the lessons that the Labour Party learns from these setbacks and the changes it makes to both its policies and practice at local government, Welsh Assembly and Westminster levels. To paraphrase James Connolly: 'Elections are not the battle, they are the echo of the battle'. But the electors of Wales have sent a very clear message, which was eloquently described by a Mrs S. Phillips from Pontyclun in a letter to the Western Mail:
The collapse of the Labour vote in Wales and the pronounced swing to Plaid, especially in the south Wales coalfield, were the result of a conscious and deliberate rejection of New Labour by a very large swathe of Labour voters. This was a very real political failure of the New Labour project. Any attempt to move forward, in the context of both British and Welsh politics must begin we would suggest with this fundamental conclusion at its heart. If the Labour Party in Wales is to meet the challenge of devolution it must conquer greater autonomy and democracy for itself and develop policies which meet the needs of the majority of the people of Wales.
A. Historical Context Table A.1 gives the votes cast for each of the four main parties from 1885 to 1999; table A.2 gives these figures as percentages of the votes cast, which are the raw data for the figure in Section 7 above. Note on Methodology Naturally, in an exercise such as this some degree of over-simplification is inevitable, as parties evolve, split, merge, form alliances, etc. over time; and often decisions over interpretation can be rather marginal (and with which readers are welcome to disagree). For the record, for both tables listed in this Appendix; over 1886 to 1910 the Conservative vote is an aggregate of the Conservative and the Liberal Unionist vote and from 1900 to January 1910 the Liberal vote is the aggregate of the Liberal and the Liberal-Labour vote. The election of 1918 defeated our attempts to draw out distinct Liberal and Conservative components, hence the blank space. In 1922 the Liberal vote is the sum of the Liberal and National Liberal votes. The 1931 Conservative vote is that of the distinct Conservative component of the national government vote, the same is true for 1935 and 1945. The Liberal vote is the distinct Liberal component of the national government vote, and the National Liberal vote is disregarded. From 1950 to 1966 the Conservative vote is an aggregate of the Conservative and the 'National Liberal and Conservative' votes. In 1983, 1984 and 1987 the Liberal vote is that of the Liberal Party and the SDP votes combined, while from 1989 onwards the Liberal vote is that of the Liberal Democrats. It should be noted that for comparative purposes, the Labour vote before 1918 in both tables is of little value as a national indicator since Labour candidates only stood in a small number of Welsh constituencies. The same point can be made with regard to Plaid before 1966, if not before 1970. It should also be noted that the period under consideration witnessed a number of alterations to the franchise: of a significant character in 1918 and 1928, and of a rather less fundamental nature in 1948-9 and 1969. Despite our comments in Section 2, it is in the analysis of long term electoral patterns that the figure of percentage votes cast really comes into its own. Why the long term patterns detected should be relatively immune to alterations in the franchise is a phenomenon often commented upon but beyond the scope of this particular discussion.
A.1 Total votes cast for the major parties in Welsh elections since 1885. (G = general election; E = European election; A = Assembly election)
A.2 Percentage share of votes cast for the major parties in Welsh elections since 1885. (G = general election; E = European election; A = Assembly election)
B. Sources and Methodology 1. The Basic Picture Barn, May 1999, p.14.
2. Who Stayed Home? 1997 votes cast and turnout: Beti Jones, Etholiadau'r Ganrif - Welsh Elections (Talybont, 1999). 1999 votes cast: Barn, May 1999, p.14. 1999 turnout calculated from raw data supplied by: The Guardian, 8 May 1999. The percentage change in the party vote is established by: (100(V2-V1)/V1), where V1 = number of votes cast in 1997 and V2 = number of votes cast in 1999.
3. Labour and Plaid's Returns: 1997 and 1999 Compared 1997 constituency figures: Befi Jones, Etholiadau'r Ganrif - Welsh Elections (Talybont, 1999). 1999 constituency figures: Western Mail, 8 May 1999.
4. Plaid's Gains Raw data sources as above. As in 2.1 above the percentage change in the party vote is established by: 100(V2-V1))/V1, where V1 = number of votes cast in 1997 and V2 = number of votes cast in 1999. The swing has been calculated using the 'Butler' formula, only using as raw data votes cast as a percentage of the electorate rather than percentage of overall votes cast. Thus: Swing = ((L1-L2)+(P2-PI))/2, where L1 = the 1997 Labour vote expressed as a percentage of the electorate, L2 = the 1999 Labour vote expressed as a percentage of the electorate, P1 = the 1997 Plaid vote expressed as a percentage of the electorate, etc. NOP poll quoted in: 'Welsh Politics in the New Millennium', John Osmond, Institute of Welsh Affairs, August 1999, p.24.
5. The Swing to Plaid Swing calculated as in 4 above.
6. Parties to the Left of Labour and Plaid 1999 constituency figures: Western Mail, 8 May 1999.
7. The Historical Conteit ( also Appendix A) All figures from Beti Jones, Etholiadau r Gannf - Welsh Elections (Talybont, 1999), except 1999 Assembly election: Barn, May 1999, p.14; and 1999 European election: Welsh Agenda, Summer 1999, p.36.
8. The View Beyond the Spin Tony Blair quote: Searchlight, March 1999, pp. 26-27. Peter Hain quote: New Statesman, 7 June 1999, pp. 18-19. Karl Davies quote: Golwg, 13 May 1999, p. 7. Paul Flynn quote: Tribune, 14 May 1999. Anthony King quote: Left Labour Briefing, July 1999, p. 6.
Conclusions S. Phillips quote: Western Mail, 19 June 1999.
|
||||||||||||||||||||||||||||||||||||||||||||||||||||||||||||||||||||||||||||||||||||||||||||||||||||||||||||||||||||||||||||||||||||||||||||||||||||||||||||||||||||||||||||||||||||||||||||||||||||||||||||||||||||||||||||||||||||||||||||||||||||||||||||||||||||||||||||||||||||||||||||||||||||||||||||||||||||||||||||||||||||||||||||||||||||||||||||||||||||||||||||||||||||||||||||||||||||||||||||||||||||||||||||||||||||||||||||||||||||||||||||||||||||||||||||||||||||||||||||||||||||||||||||||||||||||||||||||||||||||||||||||||||||||||||||||||||||||||||||||||||||||||||||||||||||||||||||||||||||||||||||||||||||||||||||||||||||||||||||||||||||||||||||||||||||||||||||||||||||||||||||||||||||||||||||||||||||||||||||||||||||||||||||||||||||||||||||||||||||||||||||||||||||||||||||||||||||||||||||||||||||||||||||||||||||||||||||||||||||||||||||||||||||||||||||||||||||||||||||||||||||||||||||||||||||||||||||||||||||||||||||||||||||||||||||||||||||||||||||||||||||||||||||||||||||||||||||||||||||||
| Return to index |