
Myocardial
Ischemia and Infarction
The ECG remains a key test in the diagnosis of acute and chronic coronary syndromes.The findings vary considerably, depending importantly on four major factors: (1) the duration of the ischemic process (acute vs. evolving/chronic), (2) its extent (transmural vs. subendocardial), (3) its topography (anterior vs. inferior-posterior and right ventricular), and (4) the presence of other underlying abnormalities (e.g., LBBB, Wolff-Parkinson-White [WPW], or pacemaker patterns) that can mask or alter the classic patterns.
Repolarization (ST-T Wave) Abnormalities
The earliest and most consistent ECG finding during acute ischemia is deviation of the ST segment as a result of a current-of-injury mechanism. Under normal conditions, the ST segment is usually nearly isoelectric (i.e., flat along the baseline) because healthy myocardial cells attain approximately the same potential during early repolarization, which corresponds to the plateau phase of the ventricular action potential. Ischemia has complex time-dependent effects on the electrical properties of myocardial cells. Severe, acute ischemia can reduce the resting membrane potential, shorten the duration of the action potential in the ischemic area, and also decrease the rate of rise and amplitude of phase 0.These changes cause a voltage gradient between normal and ischemic zones that leads to current flow between these regions. These currents of injury are represented on the surface ECG by deviation of the ST segment.
Acute ischemia may alter ventricular action potentials by
inducing lower resting membrane potential, decreased amplitude and velocity of
phase 0, and an abbreviated action potential duration (pathological early
repolarization). These electrophysiological effects create a voltage gradient
between ischemic and normal cells during different phases of the cardiac
electrical cycle. The resulting currents of injury are reflected on the surface
electrocardiogram by deviation of the ST segment.
Both diastolic and systolic injury currents have been invoked to explain ischemic ST elevations.According to the diastolic-current-of-injury hypothesis, ischemic ST elevation is attributable to negative (downward) displacement of the electrical “diastolic” baseline (TQ segment of the ECG). At least partly because of transmembrane leakage of intracellular potassium ions, ischemic cells may remain relatively depolarized during phase 4 of the ventricular action potential (i.e., lower membrane resting potential).Depolarized muscle carries a negative extracellular charge relative to repolarized muscle. Therefore, during electrical diastole, current (diastolic current of injury) will flow between the partly or completely depolarized ischemic myocardium and the normally repolarized uninjured myocardium. The injury current vector will be directed away from the more negative ischemic zone toward the electropositive normal myocardium. As a result, leads overlying the ischemic zone will record a negative deflection during electrical diastole and produce depression of the TQ segment.
|
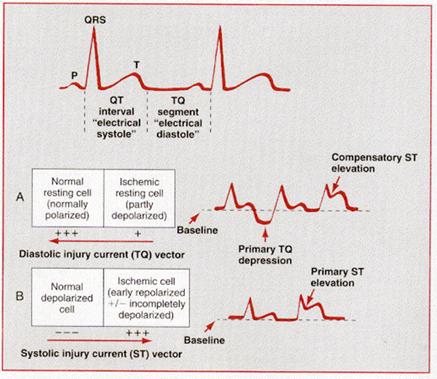
TQ segment depression, in turn, appears as ST segment elevation because the ECG recorders in clinical practice use AC-coupled amplifiers that automatically “compensate” for any negative shift in the TQ segment. As a result of this electronic compensation, the ST segment will be proportionately elevated. Therefore, according to the diastolic-current-of-injury theory, ST segment elevation represents an apparent shift. The true shift, observable only with DC-coupled ECG amplifiers, is the negative displacement of the TQ baseline.
Current evidence suggests that ischemic ST elevations (and hyperacute T waves) are also related to systolic injury currents. Three factors may make acutely ischemic myocardial cells relatively positive in comparison to normal cells with respect to their extracellular charge during electrical systole (QT interval): (1) pathological early repolarization (shortened action potential duration), (2) decreased action potential upstroke velocity, and (3) decreased action potential amplitude .The presence of one or more of these effects will establish a voltage gradient between normal and ischemic zones during the QT interval such that the current-of-injury vector will be directed toward the ischemic region. This systolic-current-of-injury mechanism will result in primary ST elevation, sometimes with tall positive (hyperacute) T waves.
When acute ischemia is transmural (whether caused by diastolic and/or systolic injury currents), the overall ST vector is usually shifted in the direction of the outer (epicardial) layers, and ST elevation and sometimes tall positive (hyperacute) T waves are produced over the ischemic zone. Reciprocal ST depressions can appear in leads reflecting the contralateral surface of the heart. (Occasionally, the reciprocal changes can be more apparent than the primary ST elevations.)When ischemia is confined primarily to the subendocardium, the overall ST vector typically shifts toward the inner ventricular layer and the ventricular cavity such that the overlying (e.g., anterior precordial) leads show ST segment depression with ST elevation in lead aVr. This subendocardial ischemic pattern is the typical finding during spontaneous episodes of angina pectoris or during symptomatic or asymptomatic (“silent”) ischemia induced by exercise or pharmacological stress tests.
Current-of-injury patterns with acute ischemia. With
predominant subendocardial ischemia (A), the resultant ST vector is directed
toward the inner layer of the affected ventricle and the ventricular cavity.
Overlying leads therefore record ST depression. With ischemia involving the
outer ventricular layer (B) (transmural or epicardial injury), the ST vector is
directed outward. Overlying leads record ST elevation. Reciprocal ST depression
can appear in contralateral leads.
Multiple factors can affect the amplitude of acute
ischemic ST deviations.
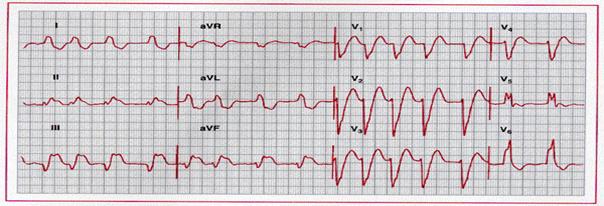
Hyperacute phase of extensive anterior-lateral myocardial
infarction. Marked ST elevation melding with prominent T waves is present across
the precordium, as well as in leads I and aVl.
ST depression, consistent with a reciprocal change, is seen in leads III and aVf.
Q waves are present in leads V3 through
V6. Marked ST elevations with
tall T waves caused by severe ischemia are sometimes referred to as a monophasic
current-of-injury pattern. A paradoxical increase in R wave amplitude (V2
and V3 ) may accompany this pattern. This tracing also shows left
axis deviation with small or absent inferior R waves, which raises the
possibility of a prior inferior infarct.
QRS
Changes
With actual infarction, depolarization (QRS) changes often accompany repolarization (ST-T) abnormalities . Necrosis of sufficient myocardial tissue can lead to decreased R wave amplitude or Q waves in the anterior, lateral, or inferior leads as a result of loss of electromotive forces in the infarcted area.Local conduction delays caused by acute ischemia can also contribute to Q wave pathogenesis in selected cases. Abnormal Q waves were once considered markers of transmural myocardial infarction, while subendocardial (nontransmural) infarcts were thought to not produce Q waves. However, careful experimental and clinical ECG-pathological correlative studies have indicated that transmural infarcts can occur without Q waves and that subendocardial infarcts can sometimes be associated with Q waves Accordingly, infarcts are better classified electrocardiographically as “Q wave” or “non-Q-wave” based on the ECG. The findings may be somewhat different with posterior or lateral infarction .Loss of depolarization forces in these regions can reciprocally increase R wave amplitude in lead V1 and sometimes V2, rarely without causing diagnostic Q waves in any of the conventional leads.
Sequence of depolarization and repolarization changes with
(A) acute anterior-lateral and (B) acute inferior wall Q wave infarctions. With
anterior-lateral infarcts, ST elevation in leads I, aVl,
and the precordial leads may be accompanied by reciprocal ST depression in leads
II, III, and aVf. Conversely,
acute inferior (or posterior) infarcts may be associated with reciprocal ST
depression in leads V1 to V3.
 |
.
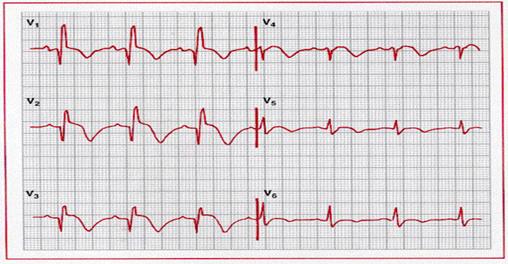
Evolving inferoposterolateral infarction. Note the
prominent Q waves in II, III and aVf,
along with ST elevation and T wave inversion in these leads, as well as V3
through V6. ST
depression in I, aVr, V1, and V2 is
consistent with a reciprocal change. Relatively tall R waves are also present in
V1 and V2.
Evolution of ECG Changes
When ischemic ST elevation and hyperacute T wave changes occur as the earliest sign of acute infarction, they are typically followed within a period ranging from hours to days by evolving T wave inversion and sometimes Q waves in the same lead distribution . T wave inversion from evolving or chronic ischemia correlates with increased ventricular action potential duration, and these ischemic changes are often associated with QT prolongation. The T wave inversion can resolve after days or weeks or persist indefinitely. The extent of the infarct may be an important determinant of T wave evolution. In one series, T waves that were persistently negative for more than 1 year in leads with Q waves were associated with a transmural infarction with fibrosis of the entire wall; in contrast, T waves that were positive in leads with Q waves correlated with nontransmural infarction with viable myocardium within the wall.
In the days to weeks or longer following infarction, the QRS changes can persist or begin to resolve. Complete normalization of the ECG following Q wave infarction is uncommon but can occur, particularly with smaller infarcts and when the left ventricular ejection fraction and regional wall motion improve. The latter is usually associated with spontaneous recanalization or good collateral circulation and is a good prognostic sign. In contrast, persistent Q waves and ST elevation several weeks or more after an infarct correlate strongly with a severe underlying wall motion disorder (akinetic or dyskinetic zone), although not necessarily a frank ventricular aneurysm. The presence of an rSR´ or similar complex in the midleft chest leads or lead I is another reported marker of ventricular aneurysm (el-Sherif sign).
Reversible transmural ischemia caused, for example, by coronary vasospasm may cause transient ST segment elevation. This pattern is the ECG marker of Prinzmetal variant angina. Depending on the severity and duration of such noninfarction ischemia, the ST elevation can either resolve completely within minutes or be followed by T wave inversion that can persist for hours or even days. Some patients with ischemic chest pain have deep coronary T wave inversion in multiple precordial leads (e.g., V1 through V4), with or without cardiac enzyme elevations. This finding is typically caused by severe ischemia associated with a high-grade stenosis in the proximal left anterior descending coronary artery system (LAD–T wave pattern). The T wave inversion may actually be preceded by a transient ST elevation that resolves by the time that the patient arrives at the hospital. These T wave inversions, in the setting of unstable angina, can correlate with segmental hypokinesis of the anterior wall and suggest a “myocardial stunning” syndrome. The natural history of this syndrome is unfavorable, with a high incidence of recurrent angina and myocardial infarction. On the other hand, patients whose baseline ECG already shows abnormal T wave inversion can experience paradoxical T wave normalization (pseudonormalization) during episodes of acute transmural ischemia. (Postinfarction regional pericarditis can also cause T wave normalization.)
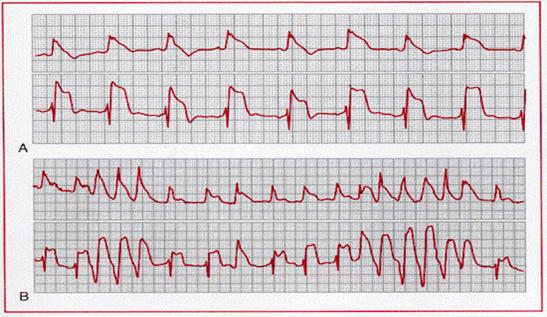
A, Prinzmetal angina with ST segment and T wave alternans.
B, ST segment and T wave alternans associated with nonsustained ventricular
tachycardia.
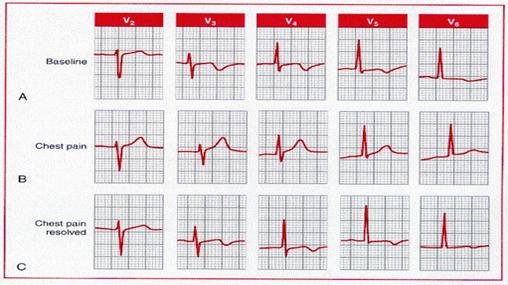
Pseudo (paradoxical) T
wave normalization. A, The baseline electrocardiogram of a patient with coronary
artery disease shows ischemic T wave inversion. B, T wave “normalization”
during an episode of ischemic chest pain. C, Following resolution of the chest
pain, the T waves have reverted to their baseline appearance.
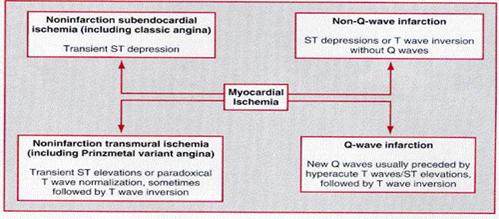
Variability of
electrocardiogram (ECG) patterns with acute myocardial ischemia. The ECG may
also be normal or nonspecifically abnormal. Furthermore, these categorizations
are not mutually exclusive. For example, a non-Q-wave infarct can evolve into a
Q wave infarct, ST elevation can be followed by a non-Q-wave infarct, or ST
depression and T wave inversion can be followed by a Q wave infarct.
ISCHEMIC U WAVE CHANGES
Alterations in U wave amplitude or polarity have been reported with acute ischemia or infarction. For example, exercise-induced transient inversion of precordial U waves has been correlated with severe stenosis of the left anterior descending coronary artery. Rarely, U wave inversion may be the earliest ECG sign of acute coronary syndromes.
Increasing interest has been shown in the effects of acute myocardial ischemia and infarction on the disparity among QT intervals in various ECG leads, referred to as QT dispersion. The greater the difference between maximum and minimum QT intervals, i.e., increased QT dispersion, the greater the variability in myocardial repolarization. An increased index has been proposed as a marker of arrhythmia risk after myocardial infarction and as a marker of acute ischemia with atrial pacing. The practical utility of QT dispersion measurements, in coronary syndromes and certain other cardiac pathologies, is a focus of current investigation
Localization of Ischemia or Infarction
The ECG leads are more helpful in
localizing regions of transmural than subendocardial ischemia. As examples, ST
elevation and/or hyperacute T waves are seen in (1) one or more of the
precordial leads (V1 through V6) and in leads I and aVl
with acute transmural anterior or anterolateral wall ischemia; (2) leads V1
to V3 with anteroseptal ischemia; (3) leads V4 to V6
with apical or lateral ischemia; (4) leads II, III, and aVf with
inferior wall ischemia; and (5) right-sided precordial leads with right
ventricular ischemia. Posterior wall infarction, which induces ST elevation in
leads placed over the back of the heart, e.g., leads V7 to V9
can be induced by lesions in the right coronary artery or left
circumflex artery. These lesions can produce both inferior and posterior-lateral
injury, which may be indirectly recognized by reciprocal ST depression in leads
V1 to V3.
The ECG can also provide more
specific information about the location of the occlusion within the coronary
system. In patients with an inferior wall myocardial infarction, the presence of
ST segment elevation in lead III exceeding that in lead II, particularly when
combined with ST elevation in V1, may be a useful predictor of an
occlusion in the proximal to midportion of the right coronary artery.
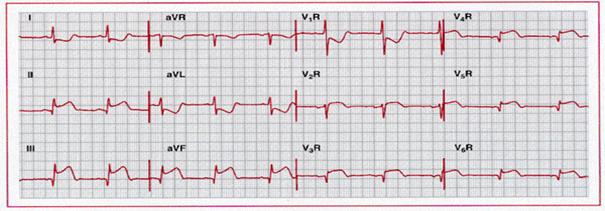
Acute right ventricular infarction with acute inferior wall
infarction. Note the ST elevation in the right precordial leads, as well as in
leads II, III, and aVf, with
reciprocal change in I and aVl.
ST elevation in lead III greater than in lead II115
and right precordial ST elevation are consistent with proximal to middle
occlusion of the right coronary artery. The combination of ST elevation in
conventional lead V1 (V2 R here) and ST depression in lead V2
(lead V1 R here)
has also been reported with acute right ventricular ischemia/infarction.
ECG Diagnosis of Bundle Branch Blocks and Myocardial Infarction
The diagnosis of myocardial infarction is often more difficult in cases in which the baseline ECG shows a bundle branch block pattern, or a bundle branch block develops as a complication of the infarct. The diagnosis of Q wave infarction is not usually impeded by the presence of RBBB, which affects primarily the terminal phase of ventricular depolarization. The net effect is that the criteria for the diagnosis of a Q wave infarct in a patient with RBBB are the same as in patients with normal conduction. The diagnosis of infarction in the presence of LBBB is considerably more complicated and confusing since LBBB alters both the early and the late phases of ventricular depolarization and produces secondary ST-T changes. These changes may both mask and mimic the findings of myocardial infarction. As a result, considerable attention has been directed to the problem of diagnosing acute and chronic myocardial infarction in patients with LBBB.
|
Complete left bundle branch block with acute inferior
myocardial infarction. Note the prominent ST segment elevation in leads II, III,
and aVf, with reciprocal ST
segment depression in I and aVl superimposed on secondary ST-T changes. The underlying
rhythm is atrial fibrillation.
Infarction of the left ventricular free (or lateral) wall ordinarily results in abnormal Q waves in the midprecordial to lateral precordial leads (and selected limb leads). However, the initial septal depolarization forces with LBBB are directed from right to left. These leftward forces produce an initial R wave in the midprecordial to lateral precordial leads, usually masking the loss of electrical potential (Q waves) caused by the infarction. Therefore, acute or chronic left ventricular free wall infarction by itself will not usually produce diagnostic Q waves in the presence of LBBB. Acute or chronic infarction involving both the free wall and the septum (or the septum itself) may produce abnormal Q waves (usually as part of the QRS complex or QrS types of complexes) in leads V4 to V6. These initial Q waves probably reflect posterior and superior forces from the spared basal portion of the septum . Thus, a wide Q wave (0.04 second) in one or more of these leads is a more reliable sign of underlying infarction. The sequence of repolarization is also altered in LBBB, with the ST segment and T wave vectors being directed opposite the QRS complex. These changes can mask or simulate the ST segment changes of actual ischemia.
A, With uncomplicated left bundle branch block, early
septal forces are directed to the left. Therefore, no Q waves will be seen in V5
and V6 (right panel ). B, With left bundle branch block
complicated by anteroseptal infarction, early septal forces may be directed
posteriorly and rightward (left panel ). Therefore, prominent Q waves may appear
in V5 and V6
as a paradoxical marker of septal infarction (right panel ). C,
Anterior wall infarction (involving septum) with left bundle branch block. Note
the presence of QR complexes in leads I, aVl,
V5, and V6.
The following points summarize the ECG signs of myocardial infarction in LBBB: (1) ST segment elevation with tall positive T waves are frequently seen in the right precordial leads with uncomplicated LBBB. Secondary T wave inversions are characteristically seen in the lateral precordial leads. However, the appearance of ST elevations in the lateral leads or ST depressions or deep T wave inversions in leads V1 to V3 strongly suggests underlying ischemia. More marked ST elevations (³0.5 mV) in leads with QS or rS waves may also be due to acute ischemia. (2) The presence of QR complexes in leads I, V5, or V6 or in II, III, and aVf with LBBB strongly suggests underlying infarction, and (3) chronic infarction is also suggested by notching of the ascending part of a wide S wave in the midprecordial leads (Cabrera sign) or the ascending limb of a wide R wave in V5 or V6 (Chapman sign). Similar principles may apply to the diagnosis of acute and chronic infarction in the presence of right ventricular pacing. Comparison between an ECG exhibiting the LBBB prior to the infarction and the present ECG is often helpful to show these changes.
