
Atrial
Abnormalities
Various pathological and physiological events alter the normal sequence of atrial activation and produce abnormal P wave patterns in the ECG. Three general categories of P wave changes will be described, including those reflecting abnormal sites or patterns of activation, those caused by left atrial abnormalities, and those resulting from right atrial abnormalities.
ABNORMAL
SITES OF ATRIAL ACTIVATION.
Shifts in the site of initial activation away from the SA node to other, ectopic sites can lead to major changes in the pattern of atrial activation and, hence, in the morphology of P waves. These shifts can occur either as escape rhythms if the normal SA nodal pacemaker fails or as accelerated ectopic rhythms if the automaticity of an ectopic site is enhanced. The resulting ECG abnormalities most commonly include recording negative P waves in the leads in which P waves are normally upright (leads I, II, aVf, and V4 through V6), with or without shortening of the PR interval.
P wave patterns may suggest the site of impulse formation based on simple vectorial principles. For example, a negative P wave in lead I predicts a left atrial rhythm. Inverted P waves in the inferior leads normally correspond to a posterior atrial site. Because of the uncertainties with this localization, these ECG patterns can as a group be referred to as ectopic atrial rhythms.
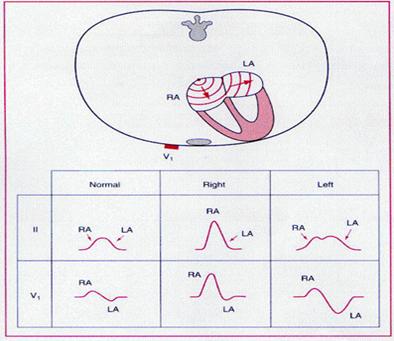
Anatomical or functional abnormalities of the left atrium alter the morphology, duration, and amplitude of the P waves in the clinical ECG. Specific abnormalities include increases in the amplitude and duration of the P wave in the limb leads, as well as an increase in the amplitude of the terminal negative portion of the P wave in lead V1.
|
|

MECHANISMS FOR ECG
ABNORMALITIES
These ECG patterns may reflect increases in left atrial mass or chamber size or reflect conduction delays within the atria. Increasing mass causes increased P wave amplitudes. Because the left atrium is activated (in general) late during the P wave, the increased electrical force accounts for the prolonged P wave duration and the augmented P terminal force in the right precordial leads.
Clinical conditions associated with these patterns also correlate with delays in interatrial conduction. For example, the interval between the onset of the P wave marking the onset of right atrial activation and the onset of left atrial activation is commonly prolonged. This delay prolongs P wave duration and shortens the PR segment. It also reduces the overlap between right and left atrial activation so that the ECG patterns generated by each atrium are separated as two notches in lead II (P mitrale).
DIAGNOSTIC ACCURACY
The diagnostic accuracy of these criteria is limited. Comparison of the various ECG abnormalities to echocardiographic criteria for left atrial enlargement demonstrates limited sensitivity but high specificity for the ECG criteria. For example, recent studies have demonstrated that the presence of classic P mitrale patterns has a sensitivity of only 20 percent but a specificity of 98 percent for detecting echocardiographically enlarged left atria and that P wave duration has limited correlation with left atrial pressure and dimension. Others have reported better correlations of these ECG abnormalities with ventricular dysfunction (e.g., with reduced ventricular compliance) than with atrial morphology. Because of the correlation of these ECG features with high atrial pressure, intraatrial conduction defects, and ventricular dysfunction, as well as increased atrial size, these ECG abnormalities are preferably referred to as criteria for left atrial abnormality rather than left atrial enlargement.
ECG findings of left atrial abnormality are associated with more severe left ventricular dysfunction in patients with ischemic heart disease and with more severe valve damage in patients with mitral or aortic valve disease. Patients with left atrial changes may have paroxysmal atrial tachyarrhythmias.
They include abnormally high P wave amplitudes in the limb and right precordial leads. As in the case of left atrial abnormality, the term right atrial abnormality is preferred over others such as right atrial enlargement.
MECHANISMS
FOR ECG ABNORMALITIES
Greater right atrial mass generates greater electrical force early during overall atrial activation, with production of taller P waves and augmentation of the initial P wave deflection in lead V1. In patients with chronic lung disease, the abnormal P pattern may reflect a more vertical heart position within the chest caused by pulmonary hyperinflation rather than true cardiac damage. The QRS changes commonly associated with right atrial abnormalities correspond to the underlying pathology that is producing the right atrial hemodynamic changes—right ventricular hypertrophy (RVH), which produces tall R waves in the right precordial leads, and a shift of the position of the heart within the chest by obstructive lung disease, which produces initial Q waves.
DIAGNOSTIC ACCURACY
As in the case of ECG criteria for left atrial abnormality, the finding of right atrial abnormality has limited sensitivity but high specificity. Echocardiographic correlations have shown, for example, that P pulmonale has very low sensitivity but very high specificity for detecting right atrial enlargement. The highest sensitivities are found for cases with a P wave initial force in lead V1 of over 0.06 mm-sec (38 percent) or with low-amplitude QRS complexes in lead V1 (33 percent).
ECG findings of right atrial abnormality are found in patients with chronic obstructive pulmonary disease. Patients with this ECG pattern have more severe pulmonary dysfunction, as well as significantly reduced survival. However, comparison of ECG and hemodynamic parameters has not demonstrated a close correlation of P wave patterns and right atrial hypertension.
Patients with abnormalities in both atria—that is, biatrial abnormality—may have ECG patterns reflecting each defect. Suggestive findings include large biphasic P waves in lead V1 and tall and broad P waves in leads II, III, and aVf.
P wave and PR segment changes can also be seen in patients with atrial infarction or pericarditis. The changes caused by these conditions will be described later in this chapter.
