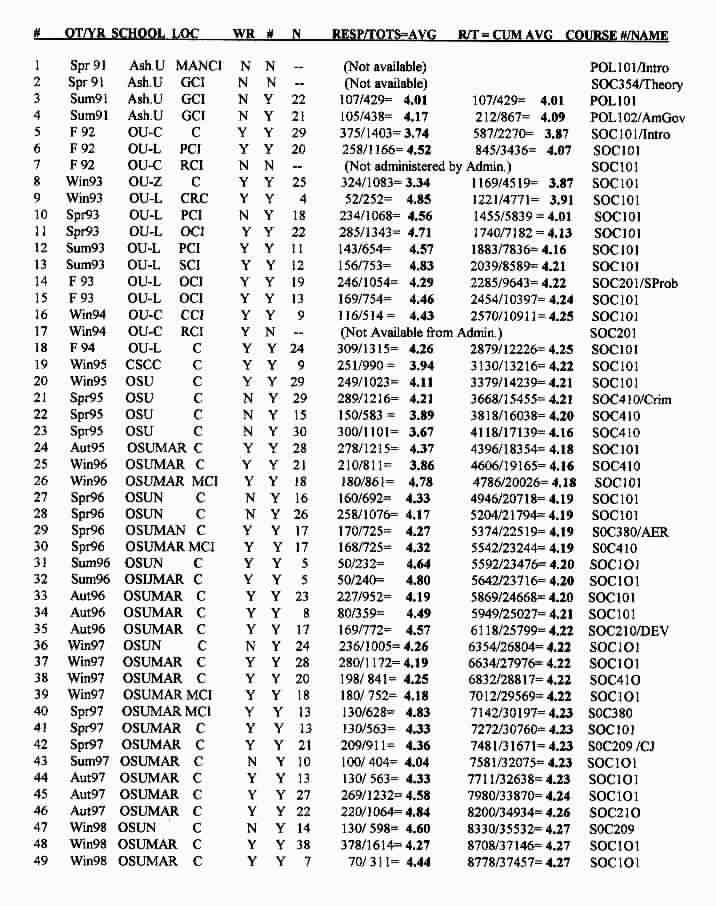
These are the results of student evaluations of me and my courses I've taught since 1985...both full and part time employment. There are some missing here and there...either evaluations weren't taken or results weren't given to me. However, most are there...per course figures and cummulative running totals.
Although some of the schools utilize a scale in which the lowest number is the "best" number, I have changed them all to a "5-4-3-2-1" scale...with "5" representing the highest. Also, I provide cummulative averages based on the actual number of responses (i.e. number of questions x number of students filling out the evaluation)...in addition to per course cummulative averages. The actual number of responses enables me to sort out just what categories are most dominant when students finish their evaluation (i.e. the percentage of responses in the highest...next to highest...etc...categories).
Student Evaluations are, at best, controversial. Some teachers dismiss them entirely...believing that students are in no position to evaluate their teaching. Others put great stock in student evaluations. I value student evaluations, having learned a lot about how I am perceived and in some cases, just what I need to change. Yet, one has to be careful in viewing them. There is probably a tendency to value those which are very complimentary and to devalue those which aren't. I think some evaluations are plainly wrong...or simply can't be taken too seriously. While I very much respect the views of students, I also know that some just aren't too aware of what's happening to them in a class. Others give lower scores because the class wasn't what they "expected." On the other hand, I think some are very insightful and should be paid close attention to in thinking about one's teaching efforts. In short, student evaluations are a mixed bag, so to speak...and should be looked at with a critical eye.
Having said all this, I am very proud of my student evaluation results over the years. I am, by no means, the "perfect" teacher. However, I believe they indicate I'm a very good college teacher and that students have on the whole responded very favorably to how and what I teach. They also represent, among other things, my progress as a teacher. They also represent different contexts (i.e. school taught at...location of the class, campus or branch...and the expectations of teachers at various schools, etc.). Some of the lower scores are probably too low and some of the highest ones are probably too high. But overall, I feel they represent my career fairly well.
These are, of course, only numbers. I have many written comments which flesh out some of the numbers, but alas, they are too numerous to present here. Most of the written comments are greatly to fairly complimentary, but there are, of course, those "other" kind of comments, too! Some are rants against me and say more about the student than me...and others are too sugary to take too seriously.
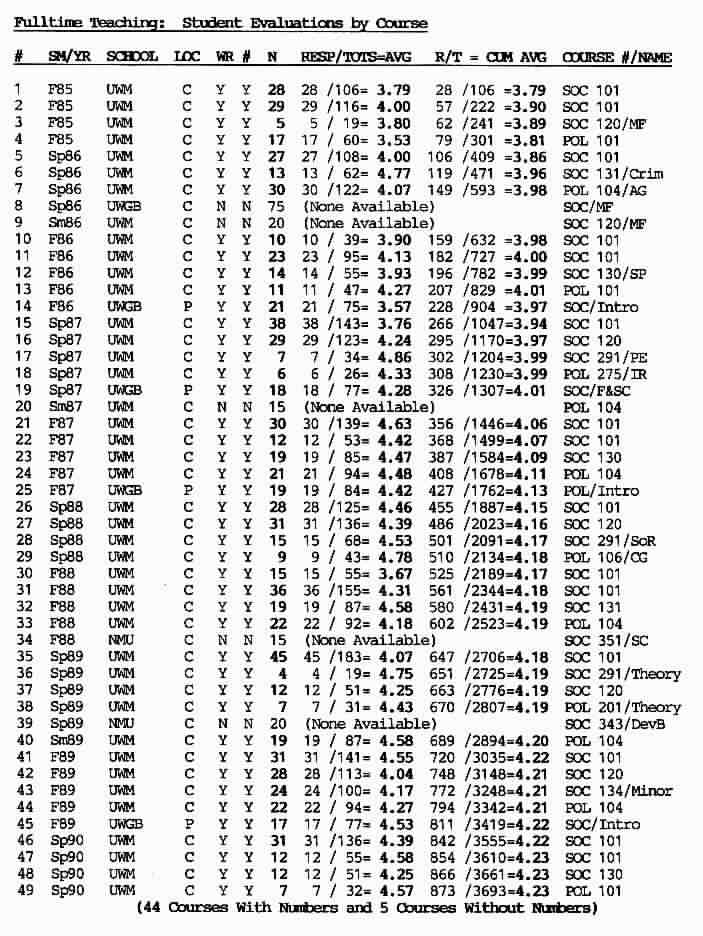
The second table portrays the evaluations of me as a full time teacher...from September 1985 to June 1990.
Each table is a jpeg image and has columns with the following designations:
Quarter and year (whether Quarter or Semester)
School
Location of class (campus, branch, prison)
Whether I have written comments too
Whether I have numbers
The NUMBER of students responding
# of Responses/Totals/and course average
Cummulative # of Responses/Totals/and running course average
Course Type and Number and Name of the course
"Legend" of the schools and locations
(You may want to copy, paste, and print this Legend for easier reference while viewing the tables)
AshU-----Ashland University (OHIO)
CCI-----Chillicothe Correctional Institution
CRC-----Correctional Reception Center
CSCC-----Columbus State Community College (OHIO)
GCI-----Grafton Correctional Institution
LCC-----Lane Community College (OR)
MANCI-----Mansfield Correctional Institution
MCI-----Marion Correctional Institution
OCI-----Orient Correctional Institution
OSU-----Ohio State University (Main Campus)
OSUMAN-----Ohio State University (Mansfield Campus)
OSUMAR-----Ohio State University (Marion Campus)
OSUN-----Ohio State University (Newark Campus)
OU-C-----Ohio University (Chillicothe Campus)
OU-L-----Ohio University (Lancaster Campus)
OU-Z-----Ohio University (Zanesville Campus)
PCI-----Pickaway Correctional Institution
RCI-----Ross Correctional Institution
SCI-----Southeastern Correctional Institution
TIUA-----Tokyo International University in America (OR)
WSUV-----Washington State University (Vancouver Campus)
WU-----Willamette University (OR)
1. Since I began teaching college in September 1985...thru June 2003
I have taught 129 college courses (49 Full time...80 Part time)
I have Student Evaluation numbers for 116 courses (44 FT and 72 PT)
4.27 for 116 courses (actual responses) (FT = 4.23...PT = 4.27)2. Have taught 19 courses (SOC and POL) in Prisons in WI and OH
Have student evaluation numbers for 15 courses
4.50 based on actual responses
4.50 based on average per course3. PT Student Evaluations by College
Ashland University (2/4) (Actual = 4.09...Avg = 4.09)
Columbus State Community College (1/1) (Actual and Avg = 3.94)
Lane Community College 16/20) (Actual = 4.60...Avg = 4.67)
Ohio University (12/14) (Actual = 4.26...Avg = 4.38)
Ohio State University (33/35) (Actual = 4.30...Avg = 4.37)
Tokyo International University in America (1/1) (Actual and Avg = 3.64)
Willamette University (4/4) (Actual = 3.64...Avg = 3.49)4. Percentage of Responses in two highest categories on Evaluations for PT teaching
(Labeled either “Excellent/Good” or “Strongly Agree/Agree”)Excellent/Strongly Agree = 59.9%
Good/Agree = 25.6%
TOTAL of both categories = 85.5%5. Percentage of Responses in two highest categories on Evaluations for FT teaching
Excellent/Strongly Agree = 42.4%
Good/Agree = 42.4%
TOTAL of both categories = 84.8%I have taught 45 Introductory Sociology courses while a part time teacher...numbers for 40 of them: 4.35 Actual Responses and 4.42 per course average 6. Introductory Sociology Courses
I have taught...as a part time teacher...14 Criminology/Criminal Justice/Juvenile Delinquency/Crime & Society courses...with numbers for 13: 4.15 actual responses & 4.19 per course average 7. Criminology/Criminal Justice Courses