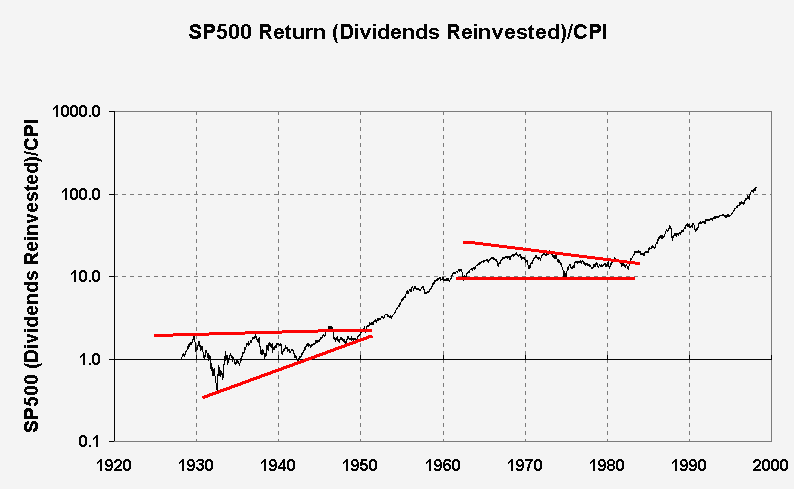
This Chart indicates inflation adjusted buying power of dividend reinvested DOW Jones over the long term.
The average length of boom or stagnation is 16-20 years. Note that from 1905 to 1921 long term investors LOST ground (16 years). (again from 1929 to 1950 -20 years)....Then again between 1966 to 1982 (16years) . In this case, listening to financial advisors who claim it's always best to buy and hold is foolish. It's easy to lose sight of reality, especially when the market has been climbing for almost two decades (Now 16 years). Irrational expectations are the present rule of day, and many investors dreams will be wiped out. Now truly is the best time to buy tangibles such as gold. (It's now around $300/ ounce.)
Note also the similarity of the present upward spike to that of 1926-1929. Yet another indicator of imminent decline.
![]()
Chart showing trend channels.
Chart showing inflation adjusted dividend re-invested Dow Jones Utilities. A big loser.
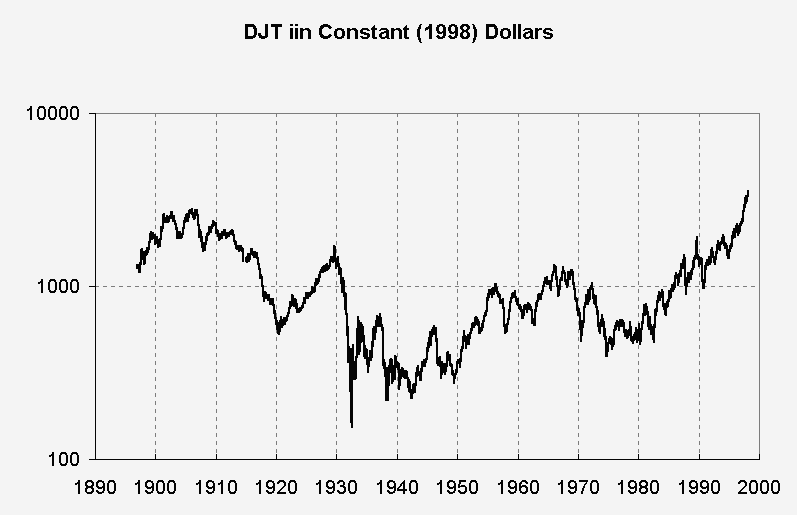
Chart showing inflation adjusted Dow Jones Transortation.
Links
Future,doomsday,year2000
back to 'STOCK MARKET FORECAST'