|
About |
      THE ECG IN 3D HEART TO LOOP TO LEADS
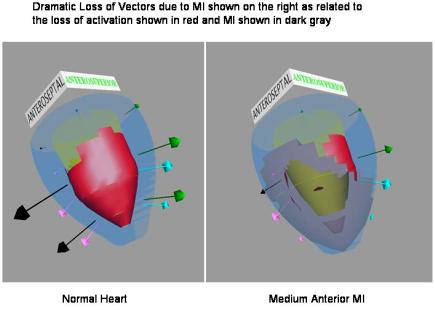
New Visual Methods using 3D illustrations to Improve the Understanding of how Myocardial Infarcts of various sizes in various locations effect the 12 Lead ECG The HEART Cardiologists are becoming increasingly challenged to use the standard 12-lead electrocardiogram (ECG) for diagnosis of the precise location and relative size of myocardial infarcts. A new method of visual training is proposed to make these diagnoses more obvious and accurate. This new method is based on developing a sound understanding of the sequence in which electrical excitation spreads through both the normal and the infracted myocardium. The student is made aware of the cardiac electrical performance through a series of 3D pictures during the excitation process. As an example of this process we see in figure 1 below a snapshot at 20 milliseconds after the start of the QRS cycle of the left ventricle of the normal heart and the heart with a medium anterior MI. This snap shot is taken from a movie of 35 frames that shows the cardiac excitation process in terms of the active surface shown in bright red and the vectors (indicated by arrows) that emerge from the activation of the 12 divisions: superior, middle, and apical sectors of each of the 4 quadrants: 1. Anteroseptal, 2. Anterosuperior, 3. Posterolateral, 4. Inferior.
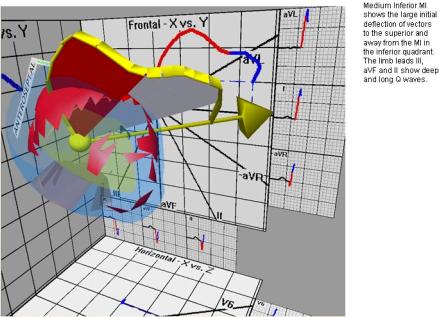
Figure 1. HEART to LOOP The cardiac electrical signal recorded on the body surface represents the summation vector of the individual vectors emerging from all of the segments at a particular point in time. Figure 2 (on the left) illustrates the summation vector at 20 msec after the onset of ventricular activation in the normal heart as presented in Figure 1. Figure 2 (on the right) illustrates the summation vectors at each serial 2.5 msec interval throughout the 80 msec duration of the ventricular activation; with the vectors at 20, 40, and 60 msec emphasized by black arrow-tipped lines. The ends of all of these serial summation vectors have been connected by a thick yellow band to form a "vector loop". The loop both begins and ends at the "electrical center of the heart", represented by the yellow ball.  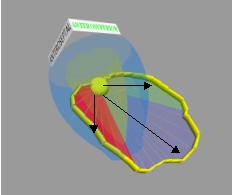 Figure 2. In Figure 3 the initial 55 msec of the vector loops from the normal heart and from the heart with the medium sized anterior MI presented in Figure 1 are shown for comparison. The yellow arrows represent the summation vectors at 55 msec in both conditions. The effect on the body surface electrical signals of the elimination of the anterior vectors by the MI appears as a distortion of the initial 40 msec of the vector loop. The MI is shown to "repel" the initial vectors and point them posteriorly and inferiorly; the inferior deviation is most obvious on the frontal plane projection. This is shown for the vector loops in 3 dimensional space, and their projection onto the horizontal plane (below) and frontal plane (behind). These projected vector loops are color coded: 0-25 msec (red), 25-50 msec (blue), and 50-75 msec (green).
Figure 3. LOOP to LEADS With this clear understanding of how the electrical activation of the ventricles of the heart as seen in the vector loop is altered by the MI induced abnormality (Heart to Loop), we can interpret the 12 lead signals of the electrocardiogram (ECG) more effectively (Loop to Leads). In the case of the Anterior MI the major effect is seen in the precordial leads, principally leads V1 to V4. The Loop to Leads relationship is shown for the complete ventricular activation period in Figure 4. This period is termed the "QRS interval" in reference to its component Q, R, and S waveforms that appear on the ECG leads. The view is from above the heart and the vector loop; and the projection of the loop onto the horizontal plane. The black lines represent the 6 horizontal plane leads, with their names (V1 to V6) indicated on their positive poles. The recordings of the body surface electrical signals on each of these 6 leads are presented. There is an upward waveform when the summation of these signals is toward the lead’s positive pole, and a downward waveform when it is in the opposite direction. The projection of the vector loop onto these leads establishes the direction and magnitude of the summated electrical signals at each point in time. The same color code and timing used for the projected vector loops is repeated in the recordings of the ECG leads. In the normal heart the summed vector loop swings around smoothly from an initial anterior direction, then to the left, then posteriorly before returning to the origin. This is reflected in the ECG leads by the gradual change in time of the peak of the R waves from V1 initially then V2, V3 and so on finally to V6. In the presence of the Anterior MI we see large Q waves in V1 and V2 and smaller Q waves in V3 and V4. These indicate the negative or posterior direction of the summed vector initially – a clear indicator of an anterior MI.
Figure 4. The ECG in 3D Program contains a variety of different activation simulations. Currently the program enables the user to view the activation simulation for all of the following examples: normal activation large, medium, and small anterior MI large, medium, and small postero-lateral MI large, medium, and small inferior MI Simulations relating to other cardiac abnormalities, such as bundle branch block and left ventricular hypertrophy, will be added in the near future. A sample of 3D illustrations of some of the other locations of MI and how this Heart to Loop to Leads method of illustration helps to identify the abnormality. Also shown is the mercator projection of the coronary artery distributions and the effects of coronary thrombosis on the obstruction of the coronary blood flow and the development of either subendocardial or transmural MI.
This figure shows a Large Anterior MI and in the top diagram the point of obstruction by coronary thrombosis in the proximal LAD (red circle) and the arteries with obstructed flow in blue. In the lower diagram are the areas in which the myocardial cells are infracted; in light blue for only subendocardial infarction, and in dark blue for transmural infarction.
|