
TopLists
Using PC Stitch
Step 6 - Importing A Graphic Into PC Stitch 6.0+:
Open up PC Stitch on your computer and click on "File" from the toolbar and choose "Import" from the dropdown box which will open up the PC Stitch Import Wizard and choose the "From A Disk File" option and click on the Browse button. Use the Browse button to tell the Wizard where you have the graphic stored at on your computer so it will import it into the PCS program, click on "Okay" in the PC Stitch Import File Selection box and then click on the "Next" button.
In the next box, this is where you would crop the graphic if needed so that you would only take in the part of the graphic you want to make into a graph. Click on the "Next" button to go to the next part of the Wizard where you can erase sections of the image by using the eraser tool or by selecting and clearing specific areas. Click on the "Next" button.
Next, you should be in the box where you can select the cloth count for use with cross-stitch and it will tell you the actual size of the stitched pattern when completed in your choice of either inches or stitches. I usually leave the checkmarks in the boxes for "Maintaining Aspect" and "Smooth Colors." Click on the "Next" button to proceed.
The next box is where you can make all kinds of color adjustments before importing the graphic into PCS. If you are anything like me, you will have to play with these settings to suit yourself since I'm still learning how to use the program. *L* You just need to click on the down arrow (shown in red on the illustration) and then choose the option you want to use and make the adjustments by using the slider if available by moving it either left or right. Some options do not use the slider such as Histo Equalize, Gray Scale, etc. - for those you simply click on the "Apply" button. I've been making use of the Histo Equalize and Gray Scale options. Look at the Previews of the graphic before and after you click to apply a change to see if it does what you want it to do. I think with this graphic, you can see the difference between the before and after versions after you have applied the Histo Equalize and the Gray Scale options? The before preview versions backgrounds look kind of off white/dirty white with different shades of black in the outlines for Scooby but once you apply the Histo Equalize and the Gray Scale options, the after preview versions look much better and it looks like it is all in 2 colors - black and white until you get the graph imported into PCS that is. *L* (Then it shows up in 2 colors....black and a very very dark navy blue and is hard to distinguish between the two of them.) Once you are satisfied with the appearance of the preview graphic, click on the "Next" button again to go to the next box.
Now you are ALMOST ready to import your graphic into PCS in this last box. *S* In this box, you will map the graphic for PCS by selecting either "Floss List" or "Floss Palette" and choosing the Floss Family you want to use in your graph for stitching/coloring. You can also set the number of colors that your graphic will display in once it is imported into PCS. I usually try to keep that number as low as possible (anywhere from 2-10) since I'll add the colors I want to use in the graphic once I have successfully imported the graphic into PCS. For the Scooby graphic, try putting a 2 into the Maximum Colors box and then click on "Preview Pattern" button and you should have something similar to this. The graphic looks good enough to me that way in the preview window so go ahead and click on the "Finish" button to import the graphic into PCS so you can begin to make the chart/graph for it. *S*
Step 7 - Making a Graph in PCS:
Congratulations! *S* You have now successfully imported a graphic into PCS and are now ready to turn the graphic into a chart/graph pattern for your own personal use! You can use whatever colors you like and do not have to keep the ones that are presently showing in the unsaved pattern for Scooby in PCS by either replacing the colors or removing them. Right now your PCS should look something similar to the illustration shown below. (Click on the illustration below for a larger/better view of it if you want one.)

One of the first things that I do is to add some different colors to the floss/palette menu and you do that by clicking on the button in the PCS toolbar that looks like 3 crayons standing on end (Look at the button under #2 in the illustration below. I put numbers above the buttons that I'm most apt to use in PCS and will refer you to the illustration below while trying to explain about the different tools/buttons on the toolbar.) By clicking on it, it will bring up the Floss Palette window box and will look similar to this one. In the Floss Palette window, you can change, add and/or remove colors, change to a different brand of floss, use a different symbol for colors, etc. 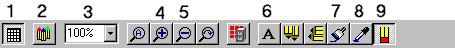 Go ahead and give it a try for yourself or feel free to use the colors I have listed below. I replaced the dark navy blue in the floss palette with DMC's #310-Black so I didn't have to worry about missing any. Then I added the following colors and letters/symbols for my Scooby7 pattern (The colors are from the DMC floss selection.):
 - #310-Black = B
- White - White = W
- #433-Brown (med.) = *
- #975-Yellow (med.) = Y
- #912-Emerald Green (lt.) = E
- #948-Peach Flesh (vy. lt) = F
- #776-Pink (med.) = P
Once you have the colors fixed to what you want, click on the OK button in the Floss Palette window to close the window and then you're ready to color or "paint" your graph. *S*
Button #7 on the Toolbar in the above illustration which looks like a paint brush is a paint brush. It's good for painting any enclosed area (especially large ones!) in a graph when you have the button down/depressed on the toolbar. If you want to put color in an individual square or just a few squares that aren't connected to each other, it's best to make sure the paintbrush button is up (not depressed) so that it will only paint one square at a time in the graph, otherwise if you aren't careful, you could end up filling in the graphic with one color. *L* (And if that does happen to you, don't panic because it is fixable one way or another. I've done that more than once in every single graph pattern that I've made so far. *chuckle* If it happens to you, you can use the CTRL key + the letter Z key to undo your last action. Otherwise you may have to try replacing the color with another or something like that. It is fixable but sometimes it does take time and/or patience to do it.)
The button appearing under #9 in the toolbar above is the eraser in PCS and at times when you're working hard on a particular graph, you might swear that there are times when that eraser is your very best friend or your own worst enemy or that your mouse's/trackball's pointer is just plain cursed. *L* When you want to paint/color a square or an area, make sure that the eraser button is "up" (not depressed) or you will have a lot of empty space that may or may not show up in color (depending on your choice of eraser color).
Button #1 controls the graph grid display so it's either on or off while you are working on your graph pattern. Some people prefer to have the grid display off while they are working on a pattern. It's all a matter of choice and finding out what works for you and what you prefer to do.
Button #3 is where you can change the viewing of your graph chart by either zooming in or zooming out. Sometimes it does help to view the graph without the grid and reducing the viewing size so you can see the whole graph at one time. Button #4 will zoom in and #5 will zoom out on the graph.
Button #6 is for putting text into/onto your graph if wanted and you will probably want to play with that when you get a chance to test things out and see how it works.
You can use Button #9 to select a color that you want to use for coloring/painting in your graph. It changes your active floss color when you move your mouse over the desired colored square and left-clicking your mouse button on the desired color so that it becomes your active floss color.
Now, I think it's time for you to do some coloring/painting on Scooby to see how the different tools all work. *S* Here is my example of the coloring and work that I did for the Scooby graph. Please note that I did make some alternations in the graphic to change the looks of it a little bit such as with the ear on the left as well as some minor changes in and around the eyes and nose. I think the changes that I made make him look more Scooby Dooish?!? *L*
Step 8 - Saving Your Work In PCS:
Once you have your graph colored in and are satisfied with it, it's time to save your work! *S* To save your work, simply click on the "File" link in the toolbar and choose "Save As" and enter in whatever name you want to use for your completed file. PCS will save your file as a PCS file under whatever name you choose to save it under with a file extension of .pat so that you can easily open up the graph pattern again in PCS and make any changes you want in it or print it out to give to friends.
If you want to send a copy of the graph to a friend who does not have PCS or the PCS Pattern Viewer, you will need to export the graph and save it as a .bmp file. But please do your friend a favor and don't send them the .bmp file version of the graph unless they specifically ask for the file as a .bmp one for some reason!!! FYI, just in case you don't already know it, .bmp files are usually very big especially when compared to .jpg or .gif files and can take a long while to download or receive via e-mail. It's much better to convert the exported .bmp file into a .jpg or .gif file to use for sending via e-mail or to use on a web page. For this particular Scooby graph, my .bmp file is 1,718KB and my .jpg file of it is only 292KB. The virtual stitch version is much less after resizing it and then saving it as a .jpg file (only 6KB!).
Step 9 - Exporting Your Work:
Once you have saved your completed graph in PCS, you may want to export the graph in order to send it via e-mail or to put up on web pages as other people and I have done. To do this, click on the "File" link in the toolbar again only this time choose "Export" which will bring up a window box similar to this. Be sure to put a check mark in the box that says "Display Grid" if there is not one already there. You can have the exported graph show your stitches as colored squares, colored stitches, B&W Symbols, Colored Symbols, Blocks & Symbols, or Virtual Stitches. With the graphs I have made, I prefer to have them show the stitches as colored squares but that choice is up to you and your preferences. *S*
Here's another illustration to show you my settings for exporting a graph file from PCS.
After you have selected your Stitch Display and the Grid Display, you should click on the "Export" button in the Export Pattern window box and wait for it to prepare the file for exporting. When PCS is done preparing the file for exporting, you should click on the "Save Image" button and naming the file whatever name you want to use for the graph. PCS will allow you to export the graph as a .bmp file only. Once that is done, I usually go back to the Export Pattern window and remove the check mark out of the box by "Display Grid" and have the Stitch Display settings as Virtual Stitches to use as an example of the finished work if it was cross-stitched. It helps other people to imagine/see just what the graph should look like when done. I also like to use the Virtual Stitches to check to see if there are any empty squares that I somehow missed when coloring it.
Here are the links for my Scooby 7 graph and the virtual stitched version as well as a link to my .pat file for Scooby 7.
Step 10 - Converting the .bmp file(s) from PCS into a graph or a virtual stitched picture:
This is where you can use IrfanViewer, MS Paint or PSP (or a similar program) to convert the .bmp files you made with PCS into smaller files that will be much easier to send via e-mail or to put on a web page. Open up IrfanViewer again if you closed it earlier, click on "File" link in the toolbar, and select "Open" from the drop-down list and find the .bmp files you saved in step #9. Click OK and then click on the "File" link in the taskbar again. Select "Save As" which should then bring up this "Save Picture As" window box and click in the box to save the file as a .jpg one. It's better not to try to resize the graph or it may not display correctly for others to view as a graph. Click on OK to save the file. Now if you saved a .bmp file with the virtual stitch displayed, you should repeat the above process to open it and then convert it into a .jpg one after you resize the .bmp file. (See the next step about how to resize a file.)
Step 11 - Resizing A Graph or Graphic File:
With IrfanViewer open, click on "File" link in the toolbar, and select "Open" from the drop-down list and find the .bmp file(s) you saved in step #9. Click OK and then click on the "Image" link in the taskbar again and select "Resize/Resample" option. I chose to reduce the virtual stitches by pixels rather than inches. I entered 120 in the box for height under the "Set new size" section and IrfanViewer automatically filled in the other box for height so the picture is now resized to 97x120 pixels. Now that the picture is resized, you should save it as a .jpg file as explained in Step 10 above.
Congratulations!
You have now completed using IrfanViewer and PC Stitch to make a graph from a graphic! *S*
 Some PC Stitch Hints & Tips from Others
- 2 Feb. 2005: You can use it for filet by using x for block and blank for mesh. Use the backstitch tool to draw in the lacets. It is a lot of work, and I have only used it for one filet kitten afghan (still in the works). It would probably be much easier with the crochet software, but since I already have this, it's what I use. - Dianne
- 3 March 2005: I have always tried to figure out how to make the graph look like the finished product, either with knitting or afghan stitch. In PC Stitch, if you set the graph to 18 sts wide and 12 sts high and not a square your graph will look like the finished afghan. I am making a dinosaur for my grandson from a graph I made using this method, and it looks exactly like the graph. I just thought you might like to play around with this method as you make such great graphs. - Julz
back - top of page - Home - Welcome - E-mail Cheryl - TOC - Next Page
 Sign Guestbook
  View Guestbook


Web page background, site, and design created by Cheryl (a.k.a. "Cinnaminn").
Originally created 23 August 2002 and updated as of 26 March 2006.
Guestbook courtesy of HTML Gear. Some graphics courtesy of Lacefairy.


