

The pattern begins with a U-shaped formation in which the stock initially drops approximately 20% to 30% from its peak (from point 1 to point 2). In this example, U.S. Surgical fell 20%. During bear markets, a decline of up to 50% may be a normal part of this chart pattern. A weak overall market or disappointing news about the company could have triggered the drop.
the stock moves sideways and drifts lower again—generally 10% to 15% during bull (up) markets and as much as 20% to 30% in bear markets. This is the "handle" part of the formation (point 4). The handle should form in the upper half of the overall pattern. For example, if the cup declines from $50 to $30, the handle should be above the $40 range. U.S. Surgical's price during its handle phase eased 7% over 11 days.
After several weeks (sometimes as little as one week), the stock jumps higher. The buy point, also referred to as the pivot point, is when the stock price breaks above the prior peak price in the handle area by at least 10 cents (point 5). The pivot is also characterized by a surge in trading volume of at least 50% above the average volume over the past 50 days (point 6). This marks an entry of mainly professional investors into the stock
The downward phase, or left side, of the cup should form over a period of at least two weeks. Typically, the left side corrects 5 to 7 weeks or more.
--A stock, during a bull market, should trade in a fairly tight price range of 10 to 15% while forming the handle. Choppy handles illustrate more uncertainty than satisfaction among shareholders.
--The handle should not drift upward. That's when the daily or weekly price lows trend upward over several weeks. Such upward-wedging handles are failure prone.
--The stock's Relative Strength Line should not lag the stock's price into new highs. It's best when the RS line preceeds or accompanies the stock's price into new high ground.
--Look at each week of the base before it breaks out. The weeks in which the stock closed up on higher volume than average should outnumber the weeks closing lower on above-average volume. This applies to the cup with handle as well as any other type of base.
--The handle should form above a stock's 200-day moving average line.
========================================================
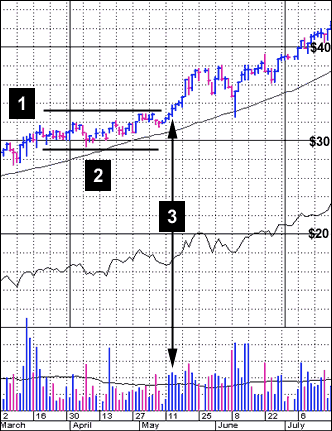
In this pattern, prices move generally sideways, slipping only 8% to 12% from their absolute high to low point over a period of at least five weeks. This pattern often occurs as a second-stage base that follows a cup with handle. A flat base may wear out some investors who grow tired of waiting for the stock to resume its climb. After this, the stage is set for a new wave of buying to push the stock higher. Let's say a stock has been trading between $29 and $32 for several weeks. The pivot point is when the stock trades at $32.10, provided that on that day trading volume surges at least 50% above normal.
Take a look at this example of Amgen in 1990, which rose to become a leading maker of drugs based on advances in cellular and molecular biology.
After drifting upward, the stock starts flattening (point 1).
--The stock traded between $29 and $32 (the lines marked by points 1 and 2) for seven weeks, as neither buyers nor sellers dominated trading.
--The stock finally breaks through May 15 at $33.38 as volume increases (point 3).
Amgen shares went on to rise about 640% from this point, in April 1990, through early 1992. In the quarters prior to this surge, it had reported accelerating sales growth of 46%, 84%, 207% and 621%. Quarterly earnings growth went as high as 700%.

==================================================================================

Recognizing The Saucer With Handle
The saucer with handle is the cousin to the cup with handle. The main difference is that the "cup" portion is more shallow and runs longer, resembling the side view of a saucer. Like with the cup with handle, this pattern reflects a temporary period of diminished enthusiasm about a stock. The price falls, though not as fast in time or as steep as seen in the cup with handle (just 12% to 20%), then climbs back to a point short of its prior peak. Next, it goes into a period where the price moves little or drifts down, forming the "handle." Finally, the stock breaks out to new high ground on heavy volume, heralding the return of professional investors into the stock. This is the buy, or pivot, point. The whole pattern takes at least eight or ten weeks to form, but is usually somewhat longer.
Check this example of Home Depot from 1996 and 1997.
The stock was making some progress until it peaked in October 1996 (point 1).
Over a 23-week period, Home Depot's price fell 18% from the peak (point 1 to point 2).
The stock recovered to get close to its old price high, then it formed a handle over the next seven weeks (point 3).
Finally, the stock broke through to new price highs as volume swelled (point 4). From this point, Home Depot shares surged about 400% over the next 32 months. The company, seizing on baby boomers' desire to fix up their homes, expanded into the world's largest chain of home-improvement super stores.
This pattern may be increasingly difficult to find, because higher market volatility has reduced the number of stocks that move in slower, tighter, saucer-like price ranges.
========================================================================================================
Double Bottom

Catching The Double Bottom
The double-bottom pattern resembles a "W," characterized by a price decline, a partial recovery and another decline before the stock returns to its previous price highs. In this pattern, nervous investors are shaken out (they sell) with each drop, eventually clearing the way for new investors to jump in. A double bottom sometimes has a "handle" just like the cup and saucer patterns.
The buy point in this pattern is when the price surpasses the highest point in the handle by at least 1/8 of a point, or the peak price in the middle part of the "W" when a handle has not occurred. In a correctly developed double bottom, the second decline should normally go slightly lower than the first decline to create a shakeout below the first low (first leg down in the "W"), and the middle point of the "W" should not go into new high ground.
In this example of American Power Conversion, which makes power protection devices for computer networks and other sensitive electronic equipment, the stock had advanced to a high in a prior uptrend (to point 1).
The stock makes the first bottom, going to $14.25 (point 2).
The stock makes an initial recovery, reaching $22.75 (point 3).
From here, American Power Conversion goes into the second sell-off, touching the $14.75 level (point 4). Notice that as the stock was in the process of bottoming, its price leveled off around $17 and volume dried up. This suggests that a selling phase is near conclusion (point 3 to point 4).
The stock finishes making the last leg up, reaching $22.25 (point 4 to 5).
From here, the stock forms a short, three-week handle (point 5 to point 6), similar to one you would find in the cup with handle. Note the volume dry up (abnormally low) around the low point of the handle, which means no further selling is coming into the stock.
Here is the correct buy point, or pivot, as the stock breaks through $22, the highest point of the handle. Also notice the surge in volume as the stock breaks out, indicating a flurry of buying by big investors (point 7).
After this breakout, American Power Conversion rose 800% over the next 22 months. Its Earnings Per Share Rating was 99 (the highest possible), the Relative Price Strength Rating was 95 (out of 99), its return on equity was a solid 54%, and annual pretax profit margin was a hefty 25% (point 8 and beyond).


Now check out Double bottom on SUNW now known as JAVA from the late 90's


