
Solar Storm MonitorCurrent Space Weather Conditions Since 2000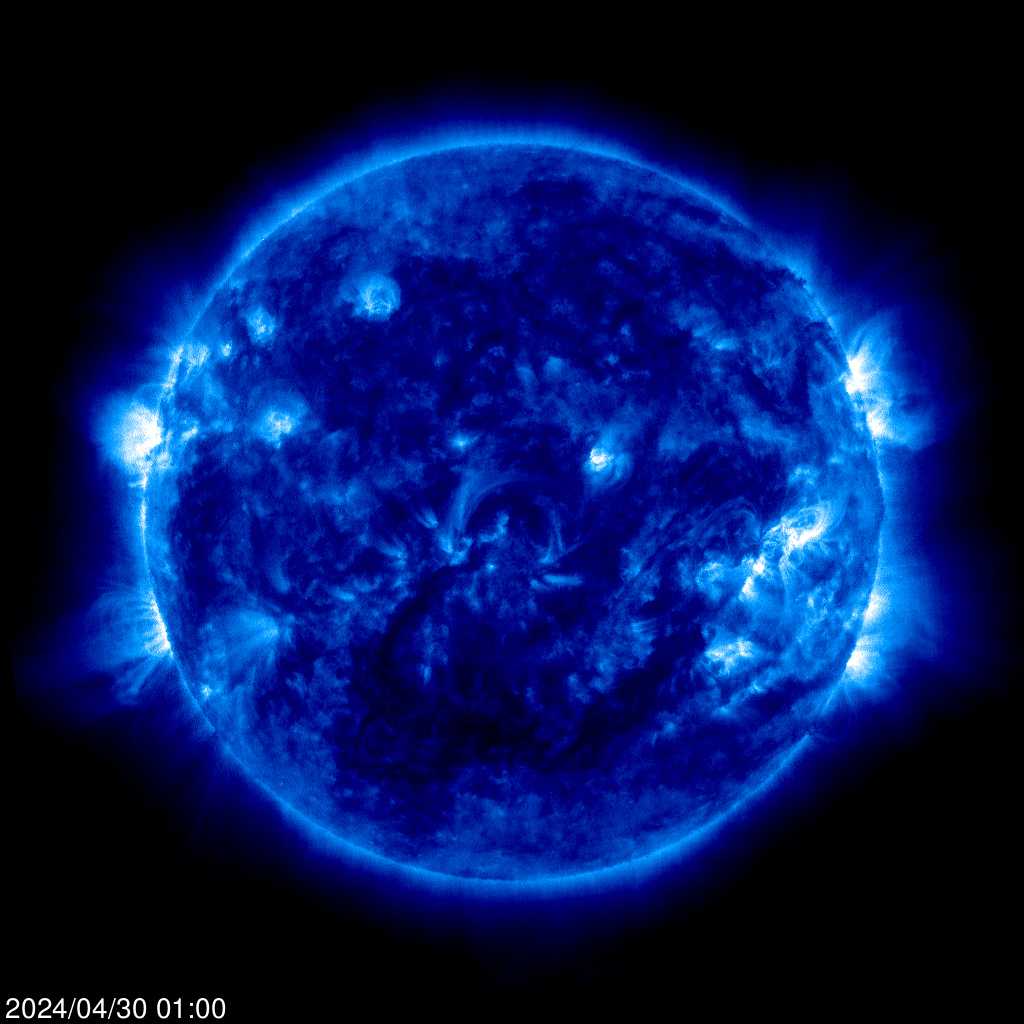
SOHO EIT 171 Latest ImageEIT (Extreme ultraviolet Imaging Telescope) images the solar atmosphere at several wavelengths, and therefore, shows solar material at different temperatures. In the images taken at 304 Angstrom the bright material is at 60,000 to 80,000 degrees Kelvin. In those taken at 171 Angstrom, at 1 million degrees. 195 Angstrom images correspond to about 1.5 million Kelvin, 284 Angstrom to 2 million degrees. The hotter the temperature, the higher you look in the solar atmosphere. 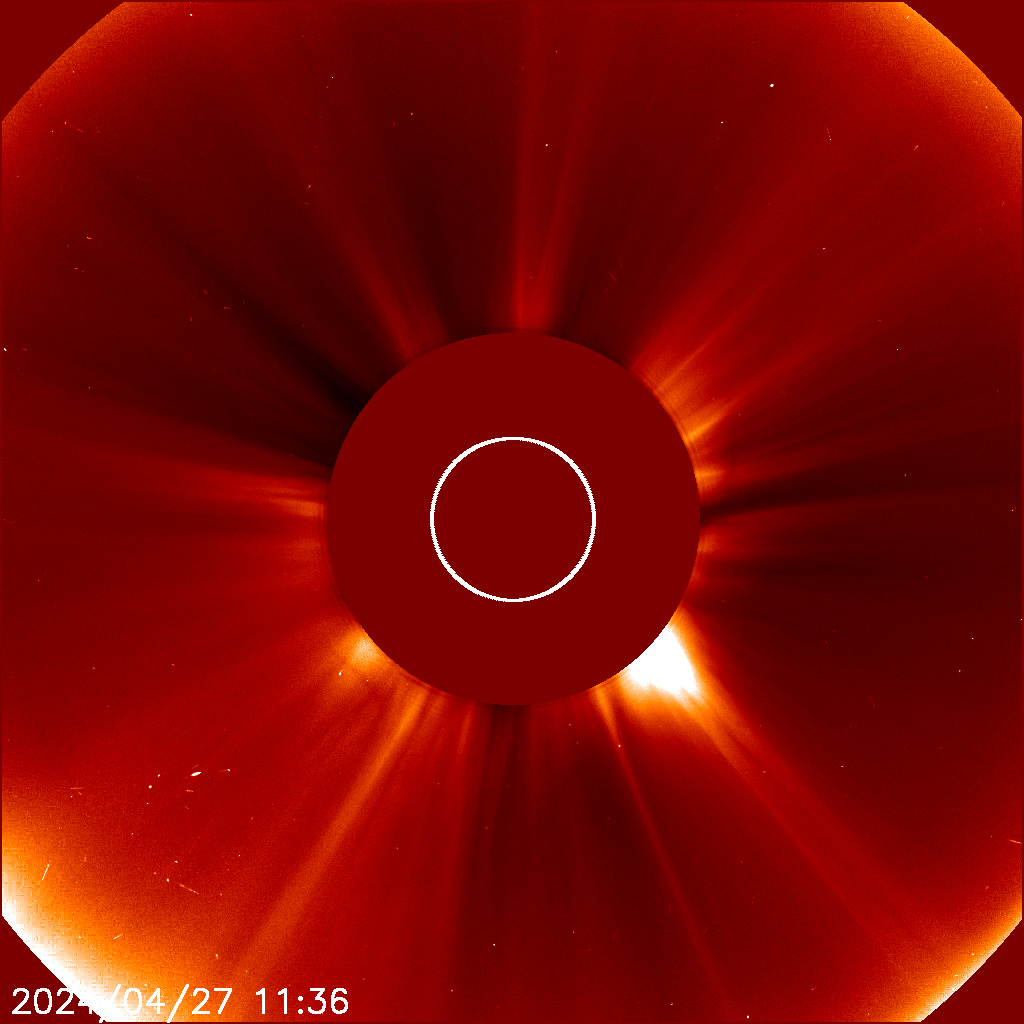
SOHO LASCO C2 Latest ImageLASCO (Large Angle Spectrometric Coronagraph) is able to take images of the solar corona by blocking the light coming directly from the Sun with an occulter disk, creating an artificial eclipse within the instrument itself. The position of the solar disk is indicated in the images by the white circle. The most prominent feature of the corona are usually the coronal streamers, those nearly radial bands that can be seen both in C2 and C3. Occasionally, a coronal mass ejection can be seen being expelled away from the Sun and crossing the fields of view of both coronagraphs. The shadow crossing from the lower left corner to the center of the image is the support for the occulter disk. C2 images show the inner solar corona up to 8.4 million kilometers (5.25 million miles) away from the Sun.
About the Solar X-ray status monitor The X-ray Solar status monitor downloads data periodically from the NOAA Space Environment Center FTP server. The previous 24 hours of 5 minute Long-wavelength X-ray data from each satellite (GOES 8 and GOES 10) is analyzed, and an appropriate level of activity for the past 24 hours is assigned as follows: Normal: Solar X-ray flux is quiet (less than = 1.00e-6 W/m^2) Active: Solar X-ray flux is active (greater than = 1.00e-6 W/m^2) M Class Flare: An M Class flare has occurred (X-ray flux greater than = 1.00e-5 W/m^2) X Class Flare: An X Class flare has occurred (X-ray flux greater than = 1.00e-4 W/m^2) Mega Flare: An unprecedented X-ray event has occurred (X-ray flux greater than = 1.00e-3 W/m^2) About the Geomagnetic Field status monitor The Geomagnetic Field status monitor downloads data periodically from the NOAA Space Environment Center FTP server. The previous 24 hours of 3 hour Planetary Kp Index data is analyzed and an appropriate level of activity for the past 24 hours is assigned as follows: Quiet: the Geomagnetic Field is quiet (Kp less than 4) Active: the Geomagnetic Field has been unsettled (Kp equal to 4) Storm: A Geomagnetic Storm has occurred (Kp greater than 4) One to four days after a flare or eruptive prominence occurs, a slower cloud of solar material and magnetic fields reaches Earth, buffeting the magnetosphere and resulting in a geomagnetic storm. These storms are extraordinary variations in Earths surface magnetic field. During a geomagnetic storm, portions of the solar wind's energy is transferred to the magnetosphere, causing Earth's magnetic field to change rapidly in direction and intensity. Geomagnetic storms are caused either by the interaction of a coronal mass ejection with the earth or by another solar phenomena called a high-speed stream, emanating from what is called a coronal hole. A coronal mass ejection is sometimes associated with a flare, but not always. It is now widely thought that the Suns magnetic fields drive the mass ejection, rather than the radiative energy released from a flare. Coronal holes are regions of open coronal magnetic fields. In these voids of the Suns atmosphere, material flows rapidly away from the sun (more than it does over the closed field regions) and a high-speed stream of solar wind forms in interplanetary space. When the high speed stream interacts with the Earth we can often see a geomagnetic storm result. Electric currents begin to flow in the upper atmosphere producing the aurora, which occurs almost simultaneously around both the north and south poles. The currents cause atmospheric heating and increased drag for satellite operators. They also induce voltages and currents in long conductors at ground level, adversely affecting pipelines and electric power grids. The energetic particles cause surface and deep dielectric charging of spacecraft. Subsequent electrostatic discharge of the excess charge build-up can damage spacecraft electronics. The ionosphere departs from its normal state, due to the currents and the energetic particles, thereby adversely affecting communications and radionavigation. Solar storms can cause danger to astronauts, for the exposure to protons and plasma from solar storms can cause radiation poisoning. Astronauts who are not within the protection of the Earths atmosphere can be exposed to a lethal dose of radiation during a large solar storm. People flying in commerical jets at high latitudes are also exposed to higher radiation. Even people on Earth are exposed to cosmic radiation, but the amount is negligible. GOES Satellite X-Ray Flux 5 Min. Data
This GOES X-ray flux plot contains 5 minute averages of solar X-ray output in the 1-8 Angstrom (0.1-0.8 nm) and 0.5-4.0 Angstrom (0.05-0.4 nm) passbands. Data from both operational GOES satellites are included. Some data dropouts will occur during satellite eclipses. SEC alerts are issued at the M5 (5x10E-5 Watts/m2) and X1 (1x10E-4 Watts/m2) levels, based upon 1-minute data. Large X-ray bursts cause short wave fades for HF propagation paths through the sunlit hemisphere. Some large flares are accompanied by strong solar radio bursts that may interfere with satellite downlinks. NASA ACE Satellite Real-Time Solar Wind Data Broadcast
How to read and understand the dials The Magnetic Field Bz Dial The Magnetic Field Bz dial ranges from -50 to +50 nT. The dial is a linear scale from -10 to +10 nT and a different linear scale from -10 to -50 nT and +10 to +50 nT. For values beyond the maximum and minimum, the arrow will stay pegged at the maximum or minimum. If the magnetic field data are missing, the arrow will not appear. The arrow will move to the location on the scale corresponding to the actual value of the latest 15 minute average of the Bz component of the magnetic field vector. The letters N and S refer to North and South of the magnetic equator. The color bar indicates green for positive values, yellow for small negative values , and red for large negative values of Bz. When the interplanetary magnetic field turns south compared to the Earth's magnetic field, geomagnetic activity will increase. As the Bz (Southward pointed) value becomes more negative, the associated geomagnetic activity increases. The Speed (V) Dial The Speed Dial ranges from 200 to 1000 km s-1. The scale is linear over the full range. For values beyond the maximum and below the minimum, the arrow will stay pegged at the maximum or minimum. If the speed data are missing, the arrow will not appear. The arrow will move to the location on the scale corresponding to the actual value of the latest 15 minute average of the Speed V of the solar wind. The color bar indicates green for low, yellow for moderate, and red for high solar wind speed. The arrow moves to indicate speed similar to a car's speedometer. The Dynamic Pressure Dial The Dynamic Pressure Dial ranges from 0.1 to 100 nPa. The scale is log10 over the full range. If the density or speed data are missing, the arrow will not appear. The arrow will move to the location on the scale corresponding to the actual value of the latest 15 minute average of the Dynamic Pressure P of the solar wind. Dynamic Pressure is a function of speed and density. The actual formula is P = 0.8363e-6 * n * V2 where Pressure P is in nPa (nano Pascals), n is the density in particles cm-3 and V is the speed in km s-1 of the solar wind. The color bar indicates green for low, yellow for moderate, and red for high dynamic pressure. The solar wind is the supersonic outflow into interplanetary space of plasma from the Sun's corona, the region of the solar atmosphere beginning about 4000 km above the Sun's visible surface and extending several solar radii into space. It is composed of approximately equal numbers of ions and electrons; the ion component consists predominantly of protons (95%), with a small amount of doubly ionized helium and trace amounts of heavier ions. Embedded in the outflowing solar wind plasma is a weak magnetic field known as the interplanetary magnetic field (IMF). The solar wind varies in density, velocity, temperature, and magnetic field properties with the solar cycle, heliographic latitude, heliocentric distance, and rotational period. It also varies in response to shocks, waves, and turbulence that perturb the interplanetary flow. Average values for solar wind velocity, density, and magnetic field strength at the orbit of the Earth are 468 km per second; density, 8.7 protons per cubic centimeter, and 6.6 nT, respectively. NASA's ACE orbits the Sun at L1, 0.99 AU from the Sun, about 1 million miles or 1.5 x 10e6 km or 230 Earth radii or 1 hour (+/- 20 minutes) upstream of Earth to give approximately 1 hour warning of geomagnetic storms. NOAA POES Satallite Auroral Map

These plots show the current extent and position of the auroral oval at each pole, extrapolated from measurements taken during the most recent polar pass of the NOAA POES satellite. The aurora borealis is electromagnetic radiation caused by electrons colliding with molecules in the ionosphere. This spectrum of electromagnetic radiation ranges from infrared to ultraviolet. The visible spectrum is dominated by white and green light produced by excited oxygen molecules and pink light emitted from nitrogen. Instruments on board the NOAA Polar-orbiting Operational Environmental Satellite (POES) continually monitor the power flux carried by the protons and electrons that produce aurora in the atmosphere. SEC has developed a technique that uses the power flux observations obtained during a single pass of the satellite over a polar region (which takes about 25 minutes) to estimate the total power deposited in an entire polar region by these auroral particles. The power input estimate is converted to an auroral activity index that ranges from 1 to 10. Images and data courtesy of NASA,
SOHO, the NOAA,
Space Environment Center,
USAF,
|


