
1.3 Company Locations and Facilities
2.3 Production Process Flow Chart
3.1 Target Market Segment Strategy
3.7 Competition and Buying Patterns
5.0 Marketing Strategy (Product Mix).
5.4 Distribution Strategy (Place)
7.2 Projected Income Statement
The company will be set up as a privately held corporation. Such a form of ownership will allow for five people to all contribute to the original investment without any worry of a partnership dissolving. Also, setting up the company now as a corporation will allow for a smoother transition in the future if IceCan Inc. decides to go public.
The total start-up expense is just under $18,000 and this will be carried as a loss on the company's balance sheet throughout the year. Most of the money for the machinery will come from our 1$250,000 loan from the BDC which represents our long-term liability. Each of the 5 parties involved in the IceCan Inc. project have agreed to put up $25,000 of their own funds to get the business off the ground.
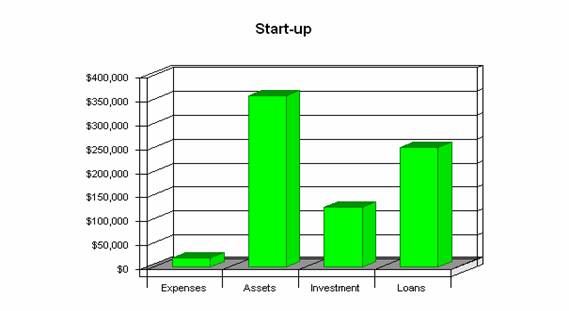
See chart on next page for detailed start-up cost breakdown
|
|
|
|
|
|

1.3 Company Locations and Facilities
The company is currently looking at leasing facilities in Markham, Ontario. The cost of a 29,810 square foot industrial unit that IceCan Inc. has shown a deep interest in is $2,200 a month. All manufacturing, distribution and administrative functions of the business will be carried out from that location including 1,471 square feet of office space.
The company will be focused on a one-product product mix, namely the Snowbalizer.
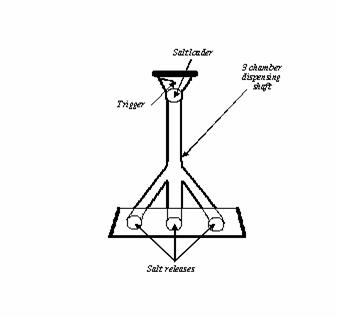
The Snowbalizer is a high-quality, Canadian-made shovel, manufactured using only quality plastics and polyethylene. The central advantage of using plastics in construction is that they are far more weather resistant and light in comparison to aluminum or other metals. The key design feature is the salt dispensing system in the shovel’s handle. Through triggering the lever, the user releases small quantities of liquid salt from three distinct rear release chambers functionally located at the back.
The production process begins with the arrival of the refined plastic shafts cut to proper length. The plastic tubing used to distribute the liquid salt is also purchased from suppliers cut to proper length. Upon arrival, the refined and raw plastics are removed from the truck using our recently purchased forklift. The inputs are stored in the factory and organized appropriately. The first step in the production process essentially sees the raw plastic pellets inputted into the four moulding machines. Two of the moulding machines are dedicated solely to creating the shovel handles. These two machines have the capability of producing as many as ten handles each at a time. The other two moulding machines produce the blades of the shovel. These two machines are capable of producing only two blades at a time. These machines essentially take the inputted raw plastic pellets, melt them down and inject the plastic into each individual mould taking the shape of the mould. Once the handles and blades are completed and cooled, they are sent along to the drilling stage of the production process. The drill press will punch five holes altogether in the blade, shaft and handle of the shovel. At this point the magic begins. The tubing and triggering mechanism are installed in the hollow shaft by a specially trained labourer. After this stage, the independent pieces of the shovel are moved along to the assembly portion of the process. This stage is characterized by a labourer assembling the shovels manually using solely industrial screws and a screwdriver. We have decided to store our inventory in our facility for the time being. For every thirty-six shovels completed, the shovels will be placed in large crates and prepared to be shipped off.
2.3 Production Process Flow Chart


![]()


![]()


![]()
Due to the seasonal nature of the product and the high costs of outsourcing storage, the company will have to manage its own inventory and keep it all in its factory. Luckily though, the company does rent a large enough location to support its inventory holding needs and we do not believe there will be any capacity issues with inventory. We will rely heavily on having a manager who is very involved in the production process and will safeguard against inventory theft etc. and we will also have an alarm system installed to protect against theft when the factory isn't open.
At IceCan Inc., our inventory system is a very straightforward process. Our raw-materials inventory consists mainly of the unrefined plastics that we purchase from a supplier. IceCan Inc. intentionally leased a facility larger than required to accommodate excess inventory. This is convenient because it allows IceCan Inc. to store its inventory while maintaining the opportunity to expand the production process and purchase more machinery without having to purchase a larger facility. When expansion does become an issue, inventory will be stored at an outsourced facility. Both the work-in-progress inventory and the finished-goods inventory are also stored in the existing facility. The snow shovels are packaged in crates, labeled and stored appropriately until they are shipped away to the retailer. In order to keep track of our inventory, we’ve established a computer-based system that will keep sound records of every item in stock.
As a brand new snow shovel manufacturer, IceCan Inc. requires a few essential elements before production may begin. The most essential of these elements is a suitable facility in which IceCan Inc. can comfortably manufacture their shovels. The facility chosen to lease is located at 510 Coronation Drive in Markham, Ontario and is 9,810 square feet. Due to the fact that IceCan Inc. has just recently begun doing business, only the one location will be necessary. The unit is listed as an industrial facility, but also comes equipped with 1,471 square feet of office space. This leaves 8,339 square feet of factory space that will easily suffice the requirements for production. The excess factory space will be used to store both raw-materials inventory and finished-goods inventory. The advantage of this location is the fact that it is very close to Toronto. With a good portion of our Canadian sales coming from Toronto, the close proximity is a gigantic plus in terms of distribution. The supply of skilled workers will also be more than sufficient because the Greater Toronto Area is populated with more than four million people7.
The production process for the Snowbalizer will utilize labour-intensive technology at first. IceCan Inc. has decided that it is important to keep initial costs down to start. This will allow us to establish the product before we expand to capital-intensive technology. IceCan Inc. has evaluated plant expenses and it seems that machinery will cost approximately $250,000. The Snowbalizer production line consists of eight labourers working full time for five months of the year. Five of these labourers are operating either the injection moulding machines or the drill press. It is necessary that these labourers have some experience operating injection moulding machines due to the complexity of the device. The other three labourers are manually assembling the shovel and packaging. See section 2.3 and 2.4 for plant layout and flowchart of production process.
When searching for a supplier of raw plastics, IceCan Inc. was looking for a high quality plastic at a reasonable price. After a long search, we found Dupont Plastics8. They will essentially supply us with all our raw plastic inputs. As far as the shafts of the shovel are concerned, a plastic manufacturer was needed. Techstar Plastics Inc. was the manufacturer chosen to produce the hollow shafts of the Snowbalizer. 9Both Dupont and Techstar are established companies that guarantee satisfaction. Both companies have a history of supplying high quality products and this is the reason IceCan Inc. believes that it will have very few problems receiving materials to standard. In terms of distribution, both companies have facilities within close proximity of our factory. Dupont Plastics Inc. has a facility in Whitby and Techstar Plastics Inc. has a facility about an hour away in Port Perry, Ontario. This will allow for a very easy flow of materials from the supplier to our facility.
At IceCan Inc. the emphasis is placed on quality first and quantity second. With this in mind, IceCan Inc. has established a very simple product inspection that will take place at the very end of the production process. The inspection will take place just prior to packaging and once the Snowbalizer is completely assembled. The same labourer in charge of packaging will undertake this job. He will be trained in the art of inspecting and made aware of the quality standards determined by management. Any shovel not meeting the required quality standards will be discarded.
Our shovel is dual-functioning, providing the customer with the ability to combine related activities and save time and effort in the already strenuous process of snow clearing. Our product also makes salt distribution a more scientific process.
IceCan Inc. is currently in talks with Dupont Plastics Incorporated to secure credit lines and purchase discounts on the raw plastic inputs needed to manufacture the product. Delivery for online sales sold directly to customers will be outsourced to FedEx, to cut down on costs of transporting the product. We also plan to distribute our product to all 450 of Canadian Tire national locations by sending our product to Canadian Tire’s distribution centre at Leslie and Highway 40110.
Through utilization of CAD/ CAM systems, manufacturing will be a highly computerized process which will allow us to eliminate the human error factor in production so as to minimize losses from easily preventable errors. As well their will be greater consistency through an automated production process.
After customer loyalty has been established, IceCan Inc. will pour money into the research and development of future plastic products where we see a great potential for innovation that will lead to breakthroughs in all fields. Early expansion will focus on other home hardware type devices but the company might also explore the possibility of medical applications for plastics.
IceCan Inc.’s target market for the Snowbalizer will be homeowner's in Canada. According to Statistics Canada’s 2001 consensus data on Toronto housing, there are approximately 1,400,000 privately owned dwellings in Toronto. In our own survey of private homes in a Toronto suburb, our data indicates that approximately one-tenth of those people shovel their own properties and would be interested in purchasing a new shovel. We use one-tenth of the total number of detached homes in our estimates of the Toronto, Ontario and Canadian market. This data would lead us to believe that there are approximately 140,000 homes that compromise potential buyers in our target market in Toronto. 200,000 in Ontario (excluding Toronto,) and 600,000 in the overall Canadian market, including Ontario11.
The market analysis graph on the next page looks at home owners in Toronto and Canada in our defined market. In the early introduction stage of The Snowbalizer’s life cycle, Toronto customers will be our primary target. However, as we grow and increase our distribution network, all parts of Canada, and the United states as well, will take on increasingly more significant roles in our total sales revenue. The growth percentages are based on Statistics Canada’s projections for the entire Canadian and Toronto population through to 200611.
11Market Analysis

3.1 Target Market Segment Strategy
We have chosen a fairly narrow description in our market segment to present you with a worst case scenario, smallest possible market. We still need only 10% market penetration or less than 1% of all Canadian single detached homes to meet our sales targets.
The Canadian marketplace is interested in snow removal products that are both cost-effective and durable. Plastics are viewed by consumers as being cheaper, lighter and more environmentally friendly than metals and the better choice. Shoveling is a task that needs to save time because it is usually done early in the morning before people depart for work. Thus the added utility of a salt dispenser will save them time and they will choose our shovel with this feature over competitors’ products without it.
We see our future target market moving away from traditional purchasing habits in brick and mortar stores and more into internet purchasing. Our business model will capitalize greatly with such a change. E-commerce in Canada is expected to grow 75.5 percent over the next five years and with our revenue being 3 times that of shovels sold to retail stores, we expect to post huge gains11.
As shovels are indeed a necessity in Canada, we see growth in the shovel market as being directly inline with general population growth over the next decade. However, growth in the overall plastics market will grow at an alarmingly higher rate as people continue to seek out products that are as durable and modifiable as plastics. We see an approximately 7 percent annual growth in plastics manufacturing over the next 10 years and increased private investment in the industry12.
There are numerous private and public corporate players in the plastics manufacturing industry. Among them, Toro, Rubbermaid and Summa Industries represent some of the biggest players in the market right now. Most of these companies have strategies that have allowed them to diversify beyond single product lines and leverage risks associated with a single product mix.
Most plastics manufacturers currently distribute their products through home care and improvement retailers. Some of the large chain retailers that sell shovels to households include Home Depot, Canadian Tire, Wal-Mart, Costco and Rona. The channels of distribution typically used in the plastic manufacturing industry do not involve many middle-men. However, seasonal products like shovels typically employ agents and wholesalers so that agents can advertise the product to retailers.
3.7 Competition and Buying Patterns
Pricing in such a small niche industry is key. Customers want durability at low costs and are not usually familiar with particular designs of individual shovels as there aren't any fundamental design differences between shovels currently available in the market place. Shovels are currently priced in the $5 to $40 range depending on the materials the shovel is made out of. To prestige clients with large disposable incomes, snow blowers start $250 for electrical snow blowers and about $400 for gas powered ones. Customers with large properties and driveways typically opt to purchase snow blowers and do not represent a reasonable target market as our product does not remove the role of actual physical effort required in snow removal.
The snow shovel manufacturing business is dominated by a few major players who operate alongside some more niche brands like those used for winter mountain hiking and camping. The top snow shovel brands for home use are Toro, Garant, Ames and Oscar. The top snow blower brands currently available in Canada include Murray and YardWorks and Toro each of who make snow blowers of various strengths and sizes10.
The Company will operate in two basic modes. From March through to July, the company will be involved mainly with production of the shovels. During this time, the company will employ eight machine workers that are required for the equipment. Their wages will range from $8.50 to $12.50 an hour and we are hoping to use high school co-op programs for at least three volunteer positions. The production workers will be responsible for operating plant machinery and the everyday maintenance of the equipment. Basic knowledge and experience on running machinery are required for these positions.
From August to February, the company will switch into distribution. Production will stop entirely, and the company will need only three employees to help ship the product off. These employees will make the same as production staff but be categorized as selling personnel. All year round, the company will employ someone who will be responsible for the day to day company business and represent the company in all general facets. The person will make $48,000 and be employed full-time.
![]()
![]()
![]()
![]()
![]()
![]()
![]()
![]()

IceCan Inc. will be a private corporation with five executives serving on the board of directors. The executives will retain possession on the majority of the company shares with a small portion available for purchase by outside investors. All members on the executive team will participate in major planning and decision-making activities. IceCan Inc. will subdivide its operations into four key internal units namely, finance, marketing, human resources and production, each of which will be under the management of an executive officer. Eight full-time general labourers will be hired to work under the VP of Production. Additional employees will be hired as the business necessitates them. Our initial goal here is to keep the amount of labour in line with our budget and projected plant capacity.
5.0 Marketing Strategy (Product Mix)
IceCan Inc. is planning a fairly extensive marketing mix for its Snowbalizer product. Included in this business plan discussion of the product mix is our web plan summary, which will be a key component of the business venture and our strategy.
All product information can be found in the Section 2 of this business plan. Please look there for any information regarding product design and the production steps involved in making the product. The Snowbalizer comes with a lifetime warranty. This product is an adaptation to a regular snow shovel. It is also a shopping product for consumers because they are willing to spend considerable time comparing prices, product features and qualities of various snow shovels. The Snowbalizer is a manufacturer brand of snow shovel.
The price of a Snowbalizer sold to retailers is $12.00 each. The price of a Snowbalizer sold on the IceCan Inc.’s web page is $19.99 which is also the product’s MSRP. As can be seen by looking at the prices of the product, the company uses the strategy of odd pricing believing that it would increase sales and, in turn, increase total revenue and profit. IceCan Inc. believes that its price will ensure the survival of the organization and be competitive in the market as well.
The prices of similar products are as follows:
Shovels18
Snow blowers18
The corporation is also using the strategy of price skimming. We are charging the highest-possible price to project an aura of quality and status over regular shovels. The price of the Snowbalizer sold on line is a competition-based price, but the price of one sold to retailers is cost-based.
IceCan Inc.'s sales strategy will focus primarily on selective advertising using less expensive forms of promotion with longer life spans. Initially newspapers and catalogues will be our main form of direct advertising with flyers being distributed in areas close to major retail distributors of our product. We hope to partially share the costs of advertising by mentioning specific locations that sell our product in the ads and sharing costs with those stores as well. Point-of-Purchase displays will act as the Snowbalizer's in-store advertising with the co-operation of our retailers. Like any manufacturer, the usage of industry trade-shows will assist in the promotion of our product toward our potential customers. Lastly IceCan Inc.’s development of an easy-to-use website will contribute to the promotion by providing customers with a purchase platform where they can buy direct but pay the same prices as in retail stores (excluding shipping and handling charges.) The site will also allow retailers to obtain the necessary information required for purchasing the product and checking on their orders. During the first year of sales, a premium will also be offered to consumers (not to retailers) purchasing the product online. The premium is a free package of liquid salt with every purchase of a Snowbalizer. IceCan Inc. believes that the promotion methods that it uses will permit it to grab a large share of the market and allow it to be in the same range as its competitors if not at a higher range than them.
5.4 Distribution Strategy (Place)
As mentioned earlier the warehouse where the Snowbalizers will be produced is located in Markham, Ontario. The shovels will held in the warehouse for up to six months before being transported to the retailers. The company will make every effort to ensure its product is as readily available as possible. The distribution of Snowbalizers happen in two separate ways. The first method occurs from producer to retailer to consumer. The Snowbalizer will be available at all Canadian Tire locations and most Canadian locations of Home Depot, Rona Home and Garden and Wal-Mart. These retail stores are described as category killers. The second method of distribution occurs from producers directly to customers from our web site. All deliveries, including international deliveries will be made by courier from producers directly to consumer through the IceCan Inc. website.
IceCan Inc.'s unique semi-online distribution system is an integral part of our direct to customer chain. It allows the company to capitalize off of consumers interested in purchasing the product directly from us, but paying similar prices to retail stores. We realize the entire eight dollar difference between the prices we sell to retailers versus directly to consumers as extra profit. As we expand and online spending and commerce grow, we hope to focus much more on our online division as it offers much greater financial rewards and opens up the possibility for international expansion.
IceCan Inc. views risk as an unavoidable component of any new business venture. However, the company does ensure that it will have strict codes of conduct for all production workers to protect their safety, including wearing safety goggles and gloves during production. The company's building will be fitted with all the common security devices such as an alarm system, smoke detectors, sprinkler systems and carbon monoxide detectors. The company will also pay $540 a month in insurance in the event we encounter problems or large liability issues. Another component of our risk management is that we have decided to organize our business as a corporation so that each of the five principle business owners has limited liability in the event that the business fails.
IceCan Inc.’s premise for success will rely on a suitable implementation of our product into the market. By doing so, we will position ourselves to take full advantage of any opportunities. Within the next month our company will undertake the following key activities:
Political:
Our company, particularly a couple of years into the future once our online site has become well-established, will be dependent on the extent governments allow free trade. If we want to avoid high costs of tariffs or other shipping restrictions, free trade agreements will be important to a healthy bottom line.
Economic:
Economically, our product is not actually a necessity and is slightly higher priced making our success somewhat dependant on people’s incomes and the overall health of the economy as it will effect the major retailers who sell our product and their levels of spending.
Social:
There are no social factors that could adversely affect our product. However, the fact that our product is entirely made in Canada could improve our image and popularity.
Technological:
We do not expect any major short term breakthroughs that would affect demand for shovels or snow blowers during the Snowbalizer's lifecycle. Due to the mechanical nature of snow blowers, they will never be priced in a similar range to our product we do not expect any major advancements in the snow removal industry.
Environmental:
Global warming and its effects on the Canadian winter will have long term effects on demand for the Snowbalizer. However, we do not see any consequences to our bottom line, at least looking at a 10 year outlook. Short term environmental fluctuations present a great risk in the initial year of operations with respect to Toronto sales, but across Canada, we see the consequences of such temperature fluxes as being insignificant.
Our sales forecast focus revenue generation into two distinct periods based on our two separate divisions. Our sales to retailers at $12 per shovel occur only between August and October when companies stock up for winter. We plan on selling 62,000 to various retailers including Canadian Tire, Costco and Rona in our first year. The direct cost associated with those shovels amount to 2/3 of the selling price. Leaving $4 net gross before factoring in production payroll and any operating and selling expenses. Our sales direct to consumers online, will see us earn $20 in revenue per shovel with the exact same costs. This brings our net cost of goods sold before production to $12. Due to these much more favourable margins, we hope to expand our online business and as well, to explore the potential for international e-commerce sales and realize much more massive potential client base. Our sales targets equal a 10% market penetration or 1% market penetration for all single detached homes.


7.2 Projected Income Statement
The company's profit and loss statement shows some clear discrepancies between monthly sales. During production periods the company is operating entirely in the red with profits only being realized during distribution periods. Production costs go from the company's gross margins for the year is 29% which are in line with other companies involved in plastics manufacturing. Most of the operating expenses (divided into categories of selling and general &administrative) come from the general and administrative portion where the company pays $48,000 a year to the company's full time manager and boss. During production $16,000 will be spent on 8 employees working a standard work week.
IceCan Inc. is planning a fairly extensive advertising plan and has ear-marked $13,750 for it which along with the $42,000 being spent on the 3 employees responsible for shipping during the company's distribution period. Of the $13,750 being spent on promotion, $5,000 will be spent on Christmas promotion alone. This will bring sales and marketing expenses to 6% of total sales. The General and Administrative costs include $48,000 for the full time manager and the typical fixed costs any company has. Differences in utilities costs are a reflection of the change from production mode to distribution. The companies plant, estimated to be worth $250,000 will be depreciated using a straight- method over 10 years to a value of $1000 which makes depreciation expense $2000 a month. Total General and Administrative expense comes out to just under 13% of total sales. All interest expenses are calculated using 5% and 7% annual expense on short and long-term liabilities respectively. Taxes are not included in this business plan.
Net profit for the year comes it a very healthy $75,000 for the first year. Net profit margin is 8% of sales in the first year and all in all the company seems like it will be able to weather the first key year of operations where most companies are made and broken. The major concern involved with the income statement is the huge discrepancies between operations during production and operations during distribution times. However, once a support structure is established, the company should be able to do fine during future years' production periods.


The company does not pay any of its non-payroll expenses in cash and waits 30 days to make payment on account. The company sells 25% of its merchandise on account with an approximate 45 day waiting period to be paid off. Interest expense is 5% annually on short-term loans and 7% on long term.
IceCan's monthly break-even analysis uses online unit revenue figures from our B2B sales. This will over-inflate the break-even quantity but allows for no sales at all in the online division where net profit is much higher. The fixed cost figure comes from our income statements total operating expenses ($170,430) divided into 12 months. This figure includes insurance, rent, utilities, advertising and depreciation expense all of which are not dependent on how many units we sell. The $9.09 variable costs come from totaling the direct cost of goods and the production payroll for the year and dividing them by 12 ($634,000/12). The company would need to move 4881 units or make $58,872 in sales in order to break-even in a given month. However, this figure does not use the $20 revenues we get off of internet sales which would lead to much lower quantities.


All information on cash management can be found in the statement of cash flows. The company does plan to operate with an inflated quick ratio over the first year to deal with any expense that come up that might need to be paid in cash. The company purchases $140,000 worth of inventory a month during the four months of production all of which is on account for the first month. The other part of accounts payable is the short term fixed expenses not paid in cash. Starting in May, the company takes out loans from the bank to pay for inventory and this fall under the current borrowing section of the balance sheet. All of these are paid off by October when the company has begun to generate revenue. The paid-in capital represents the original investment by all five business owners and the $(17,000) is negative retained earnings due to the loss at start-up carried through the entire year. Earnings over the month and year come directly from the income statement. The statement of cash flows gives a more detailed perspective on month to month changes in short and long term liabilities. By the end of the fiscal year the company is planning on having total assets worth $287,000 and a strong 68% equity ratio which will allow us to have easy access to capital in the future as creditors will not be as apprehensive about borrowing.

A more detailed cash flow statement can be found on the next page. The figures on cash from sales and receivables are derived from the monthly sales forecast in this report. 25% of sales are made on account with a 45 day estimated collection period. All wages and salaries expense come from our personnel plan and all employees are paid immediately in cash. The accounts payable component comes from our inventory needs and all purchases of inventory are made on account and paid off within a month. The other part of accounts payable is the other short term expenses which were originally credited accounts payables that are now being paid off, for example advertising expense. The current borrowing section comes from lines of credit at the back and they are needed to pay off accounts for inventory but are all paid off as soon as distribution begins. Final cash balance figures are derived from the start-up table. The company does have a fairly large amount of cash at start-up so it is acceptable that the company spends a lot of cash in the early periods of operations. The purchase of long-term assets in August for $24,000 is the estimated cost of a delivery truck that will be purchased to fulfill the company's distribution needs during that period. By year-end, the company will hopefully be able to generate enough cash to pay off $170,000 worth of our long term liabilities, mainly composed of the BDC loan. The company is cash negative for the first year of operation by $100,000 but the company did start with a massive $107,000 in cash and we see cash normalizing over the long term at around 5,000-10,000. In future periods, the company will be cash positive over the year.

1www.bdc.ca
2Lander, Gary (J.J Barnicke Real Estate)
www.jjb.com
Tel: (416) 449-1710
3www.strategis.gc.ic.ca
4De Ciantis, Mary
Senior Account Manager (Hunter, Keilty, Muntz, and Beatty Limited)
Toronto, Ontario
Tel: (416) 597-4616
5www.equipmatching.com/classified.php
6www.bellmachineryltd.com/new_bulldogzg.htm
Tel: 1-800-263-1136
8www.ca.dupon.com/NASApp/Dupontglobal/ca/index.jsp
9Conn, Ian (Techastar Plastics Incorporated
Port Perry, Ontario
Tel: 1-(905)-985-8479
10www.CanadianTire.ca
11www.StatsCan.ca
Tel: 1-800-263-1136
12www.bizminer.com
Canzer, Brahm M. et al Business; Canadian Edition. Houghton Mifflin Company: Toronto, 1999
Conn, Ian (Techastar Plastics Incorporated
Port Perry, Ontario
Tel: 1-(905)-985-8479
De Ciantis, Mary
Senior Account Manager (Hunter, Keilty, Muntz, and Beatty Limited)
Toronto, Ontario
Tel: (416) 597-4616
Lander, Gary (J.J Barnicke Real Estate)
www.jjb.com
Tel: (416) 449-1710
Figliomeni, Giuseppe
Controller, OPDI Logistics (1991)
Alliston, Ontario
Tel: (416) 364-9548
www.bdc.ca
www.strategis.gc.ic.ca
www.equipmatching.com/classified.php
www.bellmachineryltd.com/new_bulldogzg.htm
Tel: 1-800-263-1136
www.ca.dupon.com/NASApp/Dupontglobal/ca/index.jsp
www.CanadianTire.ca
www.StatsCan.ca
Tel: 1-800-263-1136
|
Personnel Plan
|
|
|
|
|
|
|
|
|
|
|
|
|
|
|
|
Year |
Apr |
May |
Jun |
Jul |
Aug |
Sep |
Oct |
Nov |
Dec |
Jan |
Feb |
Mar |
|
People |
8 |
8 |
8 |
8 |
8 |
0 |
0 |
0 |
0 |
0 |
0 |
0 |
5 |
|
Average per Person |
|
$2,000 |
$2,000 |
$2,000 |
$2,000 |
$2,000 |
$2,000 |
$2,000 |
$2,000 |
$2,000 |
$2,000 |
$2,000 |
$2,000 |
|
Subtotal |
$74,000 |
$16,000 |
$16,000 |
$16,000 |
$16,000 |
$0 |
$0 |
$0 |
$0 |
$0 |
$0 |
$0 |
$10,000 |
|
|
|
|
|
|
|
|
|
|
|
|
|
|
|
|
Sales and Marketing Personnel |
|
|
|
|
|
|
|
|
|
|
|
|
|
|
People |
3 |
0 |
0 |
0 |
0 |
3 |
3 |
3 |
3 |
3 |
3 |
3 |
0 |
|
Average per Person |
|
$0 |
$0 |
$0 |
$0 |
$2,000 |
$2,000 |
$2,000 |
$2,000 |
$2,000 |
$2,000 |
$2,000 |
$0 |
|
Subtotal |
$42,000 |
$0 |
$0 |
$0 |
$0 |
$6,000 |
$6,000 |
$6,000 |
$6,000 |
$6,000 |
$6,000 |
$6,000 |
$0 |
|
|
|
|
|
|
|
|
|
|
|
|
|
|
|
|
General and Administrative Personnel |
|
|
|
|
|
|
|
|
|
|
|
|
|
|
People |
1 |
1 |
1 |
1 |
1 |
1 |
1 |
1 |
1 |
1 |
1 |
1 |
1 |
|
Average per Person |
|
$4,000 |
$4,000 |
$4,000 |
$4,000 |
$4,000 |
$4,000 |
$4,000 |
$4,000 |
$4,000 |
$4,000 |
$4,000 |
$4,000 |
|
Subtotal |
$48,000 |
$4,000 |
$4,000 |
$4,000 |
$4,000 |
$4,000 |
$4,000 |
$4,000 |
$4,000 |
$4,000 |
$4,000 |
$4,000 |
$4,000 |
|
|
|
|
|
|
|
|
|
|
|
|
|
|
|
|
|
|
|
|
|
|
|
|
|
|
|
|
|
|
|
|
|
|
|
|
|
|
|
|
|
|
|
|
|
|
Total People |
9 |
9 |
9 |
9 |
9 |
4 |
4 |
4 |
4 |
4 |
4 |
4 |
6 |
|
Total Payroll |
|
$20,000 |
$20,000 |
$20,000 |
$20,000 |
$10,000 |
$10,000 |
$10,000 |
$10,000 |
$10,000 |
$10,000 |
$10,000 |
$14,000 |
|
Payroll Burden |
|
$0 |
$0 |
$0 |
$0 |
$0 |
$0 |
$0 |
$0 |
$0 |
$0 |
$0 |
$0 |
|
Total Payroll Expenditures |
$164,000 |
$20,000 |
$20,000 |
$20,000 |
$20,000 |
$10,000 |
$10,000 |
$10,000 |
$10,000 |
$10,000 |
$10,000 |
$10,000 |
$14,000 |
|
Sales Forecast |
|
|
|
|
|
|
|
|
|
|
|
|
|
|
Unit Sales |
2002 |
Apr |
May |
Jun |
Jul |
Aug |
Sep |
Oct |
Nov |
Dec |
Jan |
Feb |
Mar |
|
Shovel Sold to Retailers @ $12/unit |
62,000 |
0 |
0 |
0 |
0 |
16,000 |
30,000 |
16,000 |
0 |
0 |
0 |
0 |
0 |
|
Shovel's Sold Online @ $20/unit |
7,750 |
0 |
0 |
0 |
0 |
0 |
0 |
0 |
250 |
2,500 |
2,500 |
1,500 |
1,000 |
|
Total Unit Sales |
|
0 |
0 |
0 |
0 |
16,000 |
30,000 |
16,000 |
250 |
2,500 |
2,500 |
1,500 |
1,000 |
|
|
|
|
|
|
|
|
|
|
|
|
|
|
|
|
Unit Prices |
|
Apr |
May |
Jun |
Jul |
Aug |
Sep |
Oct |
Nov |
Dec |
Jan |
Feb |
Mar |
|
Shovel Sold to Retailers @ $12/unit |
$12.00 |
$12.00 |
$12.00 |
$12.00 |
$12.00 |
$12.00 |
$12.00 |
$12.00 |
$12.00 |
$12.00 |
$12.00 |
$12.00 |
$12.00 |
|
Shovel's Sold Online @ $20/unit |
$20.00 |
$20.00 |
$20.00 |
$20.00 |
$20.00 |
$20.00 |
$20.00 |
$20.00 |
$20.00 |
$20.00 |
$20.00 |
$20.00 |
$20.00 |
|
|
|
|
|
|
|
|
|
|
|
|
|
|
|
|
Sales |
|
|
|
|
|
|
|
|
|
|
|
|
|
|
Shovel Sold to Retailers @ $12/unit |
$744,000 |
$0 |
$0 |
$0 |
$0 |
$192,000 |
$360,000 |
$192,000 |
$0 |
$0 |
$0 |
$0 |
$0 |
|
Shovel's Sold Online @ $20/unit |
$155,000 |
$0 |
$0 |
$0 |
$0 |
$0 |
$0 |
$0 |
$5,000 |
$50,000 |
$50,000 |
$30,000 |
$20,000 |
|
Total Sales |
$899,000 |
$0 |
$0 |
$0 |
$0 |
$192,000 |
$360,000 |
$192,000 |
$5,000 |
$50,000 |
$50,000 |
$30,000 |
$20,000 |
|
|
|
|
|
|
|
|
|
|
|
|
|
|
|
|
Direct Unit Costs |
|
Apr |
May |
Jun |
Jul |
Aug |
Sep |
Oct |
Nov |
Dec |
Jan |
Feb |
Mar |
|
Shovel Sold to Retailers @ $12/unit |
$8.00 |
$8.00 |
$8.00 |
$8.00 |
$8.00 |
$8.00 |
$8.00 |
$8.00 |
$8.00 |
$8.00 |
$8.00 |
$8.00 |
$8.00 |
|
Shovel's Sold Online @ $20/unit |
$8.00 |
$8.00 |
$8.00 |
$8.00 |
$8.00 |
$8.00 |
$8.00 |
$8.00 |
$8.00 |
$8.00 |
$8.00 |
$8.00 |
$8.00 |
|
|
|
|
|
|
|
|
|
|
|
|
|
|
|
|
Direct Cost of Sales |
|
Apr |
May |
Jun |
Jul |
Aug |
Sep |
Oct |
Nov |
Dec |
Jan |
Feb |
Mar |
|
Shovel Sold to Retailers @ $12/unit |
$496,000 |
$0 |
$0 |
$0 |
$0 |
$128,000 |
$240,000 |
$128,000 |
$0 |
$0 |
$0 |
$0 |
$0 |
|
Shovel's Sold Online @ $20/unit |
62,000 |
$0 |
$0 |
$0 |
$0 |
$0 |
$0 |
$0 |
$2,000 |
$20,000 |
$20,000 |
$12,000 |
$8,000 |
|
Subtotal Direct Cost of Sales |
$558,000 |
$0 |
$0 |
$0 |
$0 |
$128,000 |
$240,000 |
$128,000 |
$2,000 |
$20,000 |
$20,000 |
$12,000 |
$8,000 |
|
Profit and Loss Planned |
|
|
|
|
|
|
|
|
|
|
|
|
|
|
|
2002 |
Apr |
May |
Jun |
Jul |
Aug |
Sep |
Oct |
Nov |
Dec |
Jan |
Feb |
Mar |
|
Sales |
$899,000 |
$0 |
$0 |
$0 |
$0 |
$192,000 |
$360,000 |
$192,000 |
$5,000 |
$50,000 |
$50,000 |
$30,000 |
$20,000 |
|
Direct Cost of Sales |
$558,000
|
$0 |
$0 |
$0 |
$0 |
$128,000 |
$240,000 |
$128,000 |
$2,000 |
$20,000 |
$20,000 |
$12,000 |
$8,000 |
|
Production Payroll |
$74,000 |
$16,000 |
$16,000 |
$16,000 |
$16,000 |
$0 |
$0 |
$0 |
$0 |
$0 |
$0 |
$0 |
$10,000 |
|
Other Production Expenses |
$2,000 |
$500 |
$500 |
$500 |
$500 |
$0 |
$0 |
$0 |
$0 |
$0 |
$0 |
$0 |
$0 |
|
|
|
------------ |
------------ |
------------ |
------------ |
------------ |
------------ |
------------ |
------------ |
------------ |
------------ |
------------ |
------------ |
|
Total Cost of Sales |
$634,000 |
$16,500 |
$16,500 |
$16,500 |
$16,500 |
$128,000 |
$240,000 |
$128,000 |
$2,000 |
$20,000 |
$20,000 |
$12,000 |
$18,000 |
|
Gross Margin |
$265,000 |
($16,500) |
($16,500) |
($16,500) |
($16,500) |
$64,000 |
$120,000 |
$64,000 |
$3,000 |
$30,000 |
$30,000 |
$18,000 |
$2,000 |
|
Gross Margin % |
29.48% |
0.00% |
0.00% |
0.00% |
0.00% |
33.33% |
33.33% |
33.33% |
60.00% |
60.00% |
60.00% |
60.00% |
10.00% |
|
Operating Expenses: |
|
|
|
|
|
|
|
|
|
|
|
|
|
|
Sales and Marketing Expenses: |
|
|
|
|
|
|
|
|
|
|
|
|
|
|
Sales and Marketing Payroll |
$42,000 |
$0 |
$0 |
$0 |
$0 |
$6,000 |
$6,000 |
$6,000 |
$6,000 |
$6,000 |
$6,000 |
$6,000 |
$0 |
|
Advertising/Promotion |
$13,750 |
$500 |
$250 |
$500 |
$1,000 |
$1,000 |
$1,000 |
$500 |
$1,000 |
$5,000 |
$1,000 |
$1,000 |
$1,000 |
|
Miscellaneous |
$600 |
$50 |
$50 |
$50 |
$50 |
$50 |
$50 |
$50 |
$50 |
$50 |
$50 |
$50 |
$50 |
|
|
|
------------ |
------------ |
------------ |
------------ |
------------ |
------------ |
------------ |
------------ |
------------ |
------------ |
------------ |
------------ |
|
Total Sales and Marketing Expenses |
$56,350 |
$550 |
$300 |
$550 |
$1,050 |
$7,050 |
$7,050 |
$6,550 |
$7,050 |
$11,050 |
$7,050 |
$7,050 |
$1,050 |
|
Sales and Marketing % |
6.27% |
0.00% |
0.00% |
0.00% |
0.00% |
3.67% |
1.96% |
3.41% |
141.00% |
22.10% |
14.10% |
23.50% |
5.25% |
|
General and Administrative Expenses: |
|
|
|
|
|
|
|
|
|
|
|
|
|
|
General and Administrative Payroll |
$48,000 |
$4,000 |
$4,000 |
$4,000 |
$4,000 |
$4,000 |
$4,000 |
$4,000 |
$4,000 |
$4,000 |
$4,000 |
$4,000 |
$4,000 |
|
Depreciation |
$24,000 |
$2,000 |
$2,000 |
$2,000 |
$2,000 |
$2,000 |
$2,000 |
$2,000 |
$2,000 |
$2,000 |
$2,000 |
$2,000 |
$2,000 |
|
Utilities |
$9,200 |
$1,000 |
$1,000 |
$1,000 |
$1,000 |
$600 |
$600 |
$600 |
$600 |
$600 |
$600 |
$600 |
$1,000 |
|
Insurance |
$6,480 |
$540 |
$540 |
$540 |
$540 |
$540 |
$540 |
$540 |
$540 |
$540 |
$540 |
$540 |
$540 |
|
Rent |
$26,400 |
$2,200 |
$2,200 |
$2,200 |
$2,200 |
$2,200 |
$2,200 |
$2,200 |
$2,200 |
$2,200 |
$2,200 |
$2,200 |
$2,200 |
|
|
|
------------ |
------------ |
------------ |
------------ |
------------ |
------------ |
------------ |
------------ |
------------ |
------------ |
------------ |
------------ |
|
Total General and Administrative Expenses |
$114,080 |
$9,740 |
$9,740 |
$9,740 |
$9,740 |
$9,340 |
$9,340 |
$9,340 |
$9,340 |
$9,340 |
$9,340 |
$9,340 |
$9,740 |
|
General and Administrative % |
12.69% |
0.00% |
0.00% |
0.00% |
0.00% |
4.86% |
2.59% |
4.86% |
186.80% |
18.68% |
18.68% |
31.13% |
48.70% |
|
|
|
------------ |
------------ |
------------ |
------------ |
------------ |
------------ |
------------ |
------------ |
------------ |
------------ |
------------ |
------------ |
|
Total Operating Expenses |
$170,430 |
$10,290 |
$10,040 |
$10,290 |
$10,790 |
$16,390 |
$16,390 |
$15,890 |
$16,390 |
$20,390 |
$16,390 |
$16,390 |
$10,790 |
|
Profit Before Interest |
$94,570 |
($26,790) |
($26,540) |
($26,790) |
($27,290) |
$47,610 |
$103,610 |
$48,110 |
($13,390) |
$9,610 |
$13,610 |
$1,610 |
($8,790) |
|
Interest Expense Short-term |
$6,521 |
$0 |
$625 |
$1,250 |
$1,896 |
$1,896 |
$854 |
$0 |
$0 |
$0 |
$0 |
$0 |
$0 |
|
Interest Expense Long-term |
$13,008 |
$1,458 |
$1,458 |
$1,458 |
$1,458 |
$1,458 |
$1,254 |
$1,138 |
$963 |
$817 |
$613 |
$467 |
$467 |
|
Net Profit |
$75,041 |
($28,248) |
($28,623) |
($29,498) |
($30,644) |
$44,256 |
$101,502 |
$46,973 |
($14,353) |
$8,793 |
$12,998 |
$1,143 |
($9,257) |
|
Net Profit/Sales |
8.35% |
0.00% |
0.00% |
0.00% |
0.00% |
23.05% |
28.19% |
24.46% |
-287.05% |
17.59% |
26.00% |
3.81% |
-46.28% |
|
Balance Sheet |
|
|
|
|
|
|
|
|
|
|
|
|
|
|
|
|
|
|
|
|
|
|
|
|
|
|
|
Closing |
|
Assets |
|
|
|
|
|
|
|
|
|
|
|
|
Balance |
|
Short-term Assets |
Starting Balances |
Apr |
May |
Jun |
Jul |
Aug |
Sep |
Oct |
Nov |
Dec |
Jan |
Feb |
Mar |
|
Cash |
$107,060 |
$82,185 |
$65,924 |
$49,272 |
$36,735 |
$25,988 |
($4,315) |
($31,364) |
($5,053) |
$15,033 |
$5,717 |
$719 |
$6,682 |
|
Accounts Receivable |
$0 |
$0 |
$0 |
$0 |
$0 |
$48,000 |
$112,400 |
$90,000 |
$23,650 |
$13,083 |
$18,333 |
$13,333 |
$8,500 |
|
Inventory |
$0 |
$140,000 |
$280,000 |
$420,000 |
$560,000 |
$432,000 |
$192,000 |
$64,000 |
$62,000 |
$42,000 |
$22,000 |
$10,000 |
$2,000 |
|
Total Short-term Assets |
$107,060 |
$222,185 |
$345,924 |
$469,272 |
$596,735 |
$505,988 |
$300,085 |
$122,636 |
$80,597 |
$70,116 |
$46,050 |
$24,052 |
$17,182 |
|
Long-term Assets |
|
|
|
|
|
|
|
|
|
|
|
|
|
|
Long-term Assets |
$250,000 |
$250,000 |
$250,000 |
$250,000 |
$250,000 |
$274,000 |
$274,000 |
$274,000 |
$274,000 |
$274,000 |
$274,000 |
$274,000 |
$274,000 |
|
Accumulated Depreciation |
$0 |
$2,000 |
$4,000 |
$6,000 |
$8,000 |
$10,000 |
$12,000 |
$14,000 |
$16,000 |
$18,000 |
$20,000 |
$22,000 |
$24,000 |
|
Total Long-term Assets |
$250,000 |
$248,000 |
$246,000 |
$244,000 |
$242,000 |
$264,000 |
$262,000 |
$260,000 |
$258,000 |
$256,000 |
$254,000 |
$252,000 |
$250,000 |
|
Total Assets |
$357,060 |
$470,185 |
$591,924 |
$713,272 |
$838,735 |
$769,988 |
$562,085 |
$382,636 |
$338,597 |
$326,116 |
$300,050 |
$276,052 |
$267,182 |
|
|
|
|
|
|
|
|
|
|
|
|
|
|
|
|
Liabilities and Capital |
|
|
|
|
|
|
|
|
|
|
|
|
|
|
|
|
Apr |
May |
Jun |
Jul |
Aug |
Sep |
Oct |
Nov |
Dec |
Jan |
Feb |
Mar |
|
Accounts Payable |
$0 |
$141,373 |
$141,736 |
$142,582 |
$143,689 |
$30,686 |
$6,282 |
$4,860 |
$5,174 |
$8,900 |
$4,836 |
$4,695 |
$5,081 |
|
Current Borrowing |
$0 |
$0 |
$150,000 |
$300,000 |
$455,000 |
$455,000 |
$205,000 |
$0 |
$0 |
$0 |
$0 |
$0 |
$0 |
|
Subtotal Short-term Liabilities |
$0 |
$141,373 |
$291,736 |
$442,582 |
$598,689 |
$485,686 |
$211,282 |
$4,860 |
$5,174 |
$8,900 |
$4,836 |
$4,695 |
$5,081 |
|
|
|
|
|
|
|
|
|
|
|
|
|
|
|
|
Long-term Liabilities |
$250,000 |
$250,000 |
$250,000 |
$250,000 |
$250,000 |
$250,000 |
$215,000 |
$195,000 |
$165,000 |
$140,000 |
$105,000 |
$80,000 |
$80,000 |
|
Total Liabilities |
$250,000 |
$391,373 |
$541,736 |
$692,582 |
$848,689 |
$735,686 |
$426,282 |
$199,860 |
$170,174 |
$148,900 |
$109,836 |
$84,695 |
$85,081 |
|
|
|
|
|
|
|
|
|
|
|
|
|
|
|
|
Paid-in Capital |
$125,000 |
$125,000 |
$125,000 |
$125,000 |
$125,000 |
$125,000 |
$125,000 |
$125,000 |
$125,000 |
$125,000 |
$125,000 |
$125,000 |
$125,000 |
|
Retained Earnings |
($17,940) |
($17,940) |
($17,940) |
($17,940) |
($17,940) |
($17,940) |
($17,940) |
($17,940) |
($17,940) |
($17,940) |
($17,940) |
($17,940) |
($17,940) |
|
Earnings |
$0 |
($28,248) |
($56,872) |
($86,370) |
($117,014) |
($72,758) |
$28,743 |
$75,716 |
$61,363 |
$70,157 |
$83,154 |
$84,298 |
$75,041 |
|
Total Capital |
$107,060 |
$78,812 |
$50,188 |
$20,690 |
($9,954) |
$34,302 |
$135,803 |
$182,776 |
$168,423 |
$177,217 |
$190,214 |
$191,358 |
$182,101 |
|
Total Liabilities and Capital |
$357,060 |
$470,185 |
$591,924 |
$713,272 |
$838,735 |
$769,988 |
$562,085 |
$382,636 |
$338,597 |
$326,116 |
$300,050 |
$276,052 |
$267,182 |
|
Net Worth |
$107,060 |
$78,812 |
$50,188 |
$20,690 |
($9,954) |
$34,302 |
$135,803 |
$182,776 |
$168,423 |
$177,217 |
$190,214 |
$191,358 |
$182,101 |
|
Cash Flow |
2002 |
May |
Jun |
Jul |
Aug |
Sep |
Oct |
Nov |
Dec |
Jan |
Feb |
Mar |
|
||||||||||||
|
|
|
|
|
|
|
|
|
|
|
|
|
|
|
||||||||||||
|
Cash Received |
|
|
|
|
|
|
|
|
|
|
|
|
|
||||||||||||
|
Cash from Operations: |
|
|
|
|
|
|
|
|
|
|
|
|
|
||||||||||||
|
Cash Sales |
$674,250 |
$0 |
$0 |
$0 |
$144,000 |
$270,000 |
$144,000 |
$3,750 |
$37,500 |
$37,500 |
$22,500 |
$15,000 |
|
||||||||||||
|
From Receivables |
$216,250 |
$0 |
$0 |
$0 |
$0 |
$25,600 |
$70,400 |
$67,600 |
$23,067 |
$7,250 |
$12,500 |
$9,833 |
|
||||||||||||
|
Subtotal Cash from Operations |
$890,500 |
$0 |
$0 |
$0 |
$144,000 |
$295,600 |
$214,400 |
$71,350 |
$60,567 |
$44,750 |
$35,000 |
$24,833 |
|
||||||||||||
|
|
|
|
|
|
|
|
|
|
|
|
|
|
|
||||||||||||
|
Additional Cash Received |
|
|
|
|
|
|
|
|
|
|
|
|
|
||||||||||||
|
New Current Borrowing |
$455,000 |
$150,000 |
$150,000 |
$155,000 |
$0 |
$0 |
$0 |
$0 |
$0 |
$0 |
$0 |
$0 |
|
||||||||||||
|
Subtotal Cash Received |
$1,345,500 |
$150,000 |
$150,000 |
$155,000 |
$144,000 |
$295,600 |
$214,400 |
$71,350 |
$60,567 |
$44,750 |
$35,000 |
$24,833 |
|||||||||||||
|
|
|
|
|
|
|
|
|
|
|
|
|
|
|
||||||||||||
|
Expenditures |
|
May |
Jun |
Jul |
Aug |
Sep |
Oct |
Nov |
Dec |
Jan |
Feb |
Mar |
|
||||||||||||
|
Expenditures from Operations: |
|
|
|
|
|
|
|
|
|
|
|
|
|
||||||||||||
|
Wages, Salaries, Payroll Taxes, etc. |
$164,000 |
$20,000 |
$20,000 |
$20,000 |
$10,000 |
$10,000 |
$10,000 |
$10,000 |
$10,000 |
$10,000 |
$10,000 |
$14,000 |
|
||||||||||||
|
Payment of Accounts Payable |
$656,878 |
$146,261 |
$146,653 |
$147,537 |
$144,748 |
$30,903 |
$6,449 |
$5,038 |
$5,481 |
$9,067 |
$4,998 |
$4,870 |
|
||||||||||||
|
Subtotal Spent on Operations |
$820,878 |
$166,261 |
$166,653 |
$167,537 |
$154,748 |
$40,903 |
$16,449 |
$15,038 |
$15,481 |
$19,067 |
$14,998 |
$18,870 |
|
||||||||||||
|
|
|
|
|
|
|
|
|
|
|
|
|
|
|
||||||||||||
|
Additional Cash Spent |
|
|
|
|
|
|
|
|
|
|
|
|
|
||||||||||||
|
Principal Repayment of Current Borrowing |
$455,000 |
$0 |
$0 |
$0 |
$0 |
$250,000 |
$205,000 |
$0 |
$0 |
$0 |
$0 |
$0 |
|
||||||||||||
|
Long-term Liabilities Principal Repayment |
$170,000 |
$0 |
$0 |
$0 |
$0 |
$35,000 |
$20,000 |
$30,000 |
$25,000 |
$35,000 |
$25,000 |
$0 |
|
||||||||||||
|
Purchase Long-term Assets |
$24,000 |
$0 |
$0 |
$0 |
$24,000 |
$0 |
$0 |
$0 |
$0 |
$0 |
$0 |
$0 |
|
||||||||||||
|
Adjustment for Assets Purchased on Credit |
($24,000) |
$0 |
$0 |
$0 |
($24,000) |
$0 |
$0 |
$0 |
$0 |
$0 |
$0 |
$0 |
|
||||||||||||
|
Subtotal Cash Spent |
$1,445,878 |
$166,261 |
$166,653 |
$167,537 |
$154,748 |
$325,903 |
$241,449 |
$45,038 |
$40,481 |
$54,067 |
$39,998 |
$18,870 |
|
||||||||||||
|
|
|
|
|
|
|
|
|
|
|
|
|
|
|
||||||||||||
|
Net Cash Flow |
($100,378) |
($16,261) |
($16,653) |
($12,537) |
($10,748) |
($30,303) |
($27,049) |
$26,312 |
$20,086 |
($9,317) |
($4,998) |
$5,963 |
|
||||||||||||
|
Cash Balance |
$6,682 |
$65,924 |
$49,272 |
$36,735 |
$25,988 |
($4,315) |
($31,364) |
($5,053) |
$15,033 |
$5,717 |
$719 |
$6,682 |
|
||||||||||||
